Confirming you are not from the U.S. or the Philippines

یہ بیان دے کر، میں واضح طور پر یہ بتاتا اور تصدیق کرتا ہوں کہ:
  • میں امریکی شہری یا رہائشی نہیں ہوں
  • میں فلپائن کا رہائشی نہیں ہوں
  • میں بالواسطہ یا بلاواسطہ امریکی باشندوں کے 10 فیصد سے زیادہ شیئرز/ ووٹنگ کا حق/ امریکی باشندوں کے انٹرسٹ کا مالک نہیں ہوں اور/یا دوسرے ذرائع سے امریکی شہریوں یا رہائشیوں کو کنٹرول نہیں کرتا ہوں۔
  • میں بالواسطہ یا بلاواسطہ امریکی باشندوں کے 10 فیصد سے زیادہ شیئرز/ ووٹنگ کا حق/ انٹرسٹ کا مالک نہیں ہوں اور/ یا کسی دوسرے ذریعے سے امریکی شہری یا رہائشی کے کنٹرول میں نہیں ہوں۔
  • میں FATCA کے سیکشن (a)1504 کے معاملے میں امریکی شہریوں یا رہائشیوں کے ساتھ وابستہ نہیں ہوں
  • میں غلط اعلان کرنے پر اپنی ذمہ داری سے واقف ہوں۔
اس بیان کے مقاصد کے لئے، ریاستہائے متحدہ امریکہ کے تمام منحصر ممالک اور علاقوں کو امریکہ کے مرکزی علاقے کے برابر کردیا گیا ہے۔ میں اپنے اس بیان کی خلاف ورزی سے پیدا ہونے یا اس سے متعلق ہونے والے کسی بھی دعوے کے خلاف، بے ضرر آکٹا مارکیٹس انکارپوریٹڈ، اس کے ڈائریکٹرز اور افسران کا دفاع کرنے کا عہد کرتا ہوں۔
ہم آپ کی رازداری اور آپ کی ذاتی معلومات کے تحفظ کے لیے وقف ہیں۔ ہم محض اپنی پراڈکٹس اور سروسز کے متعلق خصوصی پیشکشوں اور اہم معلومات فراہم کرنے کے لیے ای میلز اکٹھا کرتے ہیں۔ اپنا ای میل ایڈریس دے کر، آپ ہم سے ایسے ای میلز وصول کرنے پر اتفاق کرتے ہیں۔ اگر آپ انسبسکرائب کرنا چاہتے ہیں یا کوئی سوالات یا خدشات ہوں تو، ہماری کسٹمر سپورٹ کو لکھیں۔
Octa trading broker
ٹریڈنگ اکاؤنٹ کھولیں
Back

NZD/USD Price Analysis: Kiwi limited while under 0.6350

  • Volatility and erratic moves during the last trading session of the year.
  • NZD/USD to end year with a 7.30% loss.
  • The 0.6500 has the key to more gains for the Kiwi.

The NZD/USD is trading above 0.6300 during the last trading day of 2022. On a volatile session the pair hit the highest level in a week at 0.6373 and then pulled back to the 0.6330 zone.

The Kiwi is among the worst performers on Friday, on a volatile final trading day of 2022. For the year, the NZD lagged among commodity currencies, even after the recovery of the last quarter.

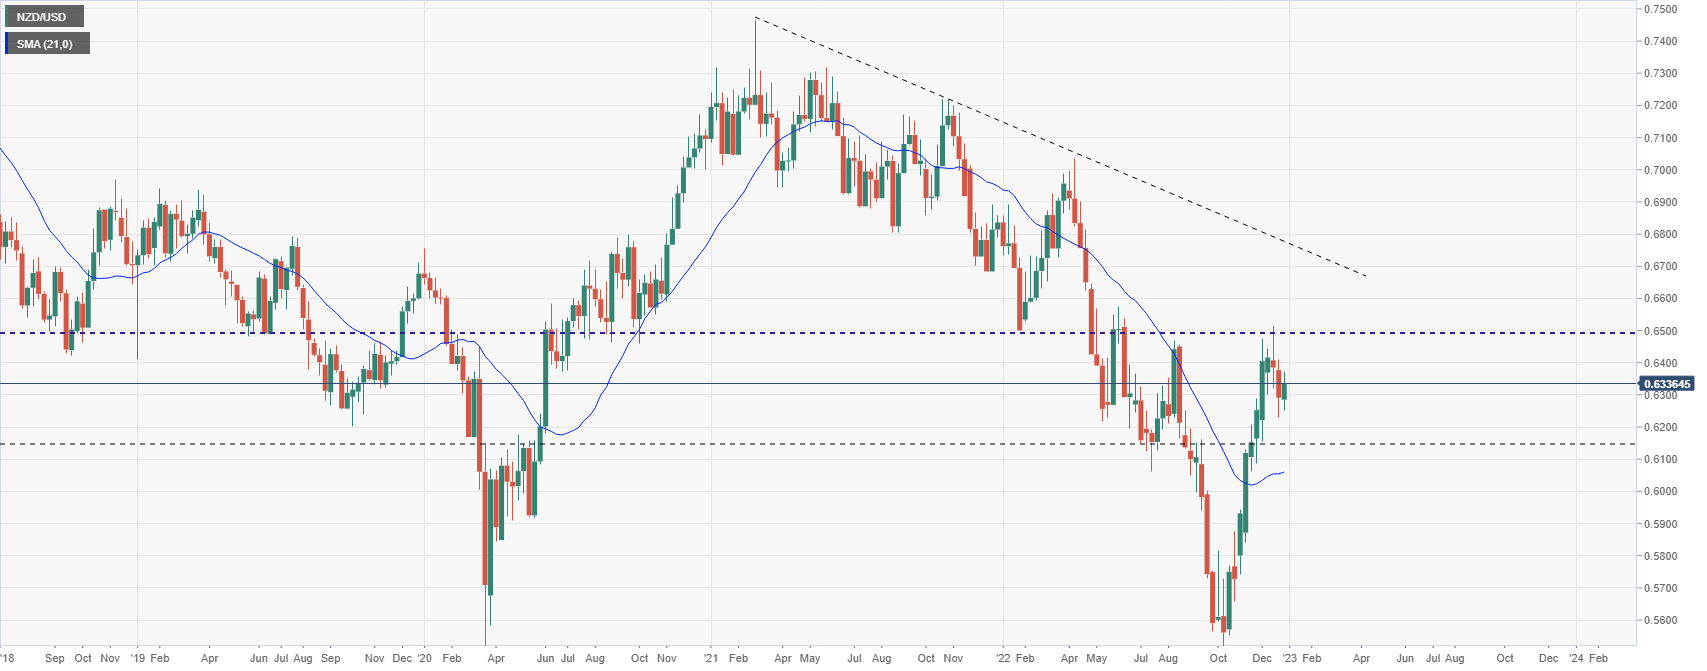
The NZD/USD bottomed during 2022 at 0.5512 in early October. It then started to recovery, trimming yearly losses. The upside move peaked slightly above 0.6500 two weeks ago. The 0.6500 area is a strong barrier that if broken should open the doors to more gains for the Kiwi.

The daily chart shows NZD/USD testing the 20-day Simple Moving Average that is hovering around 0.6350, a horizontal resistance area. While below, risks are tilted toward another test of the bottom of the current range at 0.6240. A daily close well above 0.6350 would point to further gains.

NZD/USD daily chart

NZDUSD D

NZD/USD weekly chart

NZDUSD W

Technical levels


More downside ahead for Iron Ore – ING

Iron Ore has been one of the worst-performing commodities this year. Hopes of a China recovery in the second half of 2023 should provide support in th
مزید پڑھیں Previous

CNY weakness should persist – Credit Suisse

Economists at Credit Suisse expect the Chinese Yuan to continue weakening in the coming months. Asia FX complex is likely to remain weak in the first
مزید پڑھیں Next