Confirming you are not from the U.S. or the Philippines

یہ بیان دے کر، میں واضح طور پر یہ بتاتا اور تصدیق کرتا ہوں کہ:
  • میں امریکی شہری یا رہائشی نہیں ہوں
  • میں فلپائن کا رہائشی نہیں ہوں
  • میں بالواسطہ یا بلاواسطہ امریکی باشندوں کے 10 فیصد سے زیادہ شیئرز/ ووٹنگ کا حق/ امریکی باشندوں کے انٹرسٹ کا مالک نہیں ہوں اور/یا دوسرے ذرائع سے امریکی شہریوں یا رہائشیوں کو کنٹرول نہیں کرتا ہوں۔
  • میں بالواسطہ یا بلاواسطہ امریکی باشندوں کے 10 فیصد سے زیادہ شیئرز/ ووٹنگ کا حق/ انٹرسٹ کا مالک نہیں ہوں اور/ یا کسی دوسرے ذریعے سے امریکی شہری یا رہائشی کے کنٹرول میں نہیں ہوں۔
  • میں FATCA کے سیکشن (a)1504 کے معاملے میں امریکی شہریوں یا رہائشیوں کے ساتھ وابستہ نہیں ہوں
  • میں غلط اعلان کرنے پر اپنی ذمہ داری سے واقف ہوں۔
اس بیان کے مقاصد کے لئے، ریاستہائے متحدہ امریکہ کے تمام منحصر ممالک اور علاقوں کو امریکہ کے مرکزی علاقے کے برابر کردیا گیا ہے۔ میں اپنے اس بیان کی خلاف ورزی سے پیدا ہونے یا اس سے متعلق ہونے والے کسی بھی دعوے کے خلاف، بے ضرر آکٹا مارکیٹس انکارپوریٹڈ، اس کے ڈائریکٹرز اور افسران کا دفاع کرنے کا عہد کرتا ہوں۔
ہم آپ کی رازداری اور آپ کی ذاتی معلومات کے تحفظ کے لیے وقف ہیں۔ ہم محض اپنی پراڈکٹس اور سروسز کے متعلق خصوصی پیشکشوں اور اہم معلومات فراہم کرنے کے لیے ای میلز اکٹھا کرتے ہیں۔ اپنا ای میل ایڈریس دے کر، آپ ہم سے ایسے ای میلز وصول کرنے پر اتفاق کرتے ہیں۔ اگر آپ انسبسکرائب کرنا چاہتے ہیں یا کوئی سوالات یا خدشات ہوں تو، ہماری کسٹمر سپورٹ کو لکھیں۔
Octa trading broker
ٹریڈنگ اکاؤنٹ کھولیں
Back

WTI Price Analysis: Bulls are waiting in the flanks of the Fibonacci scale

  • The oil price is on the backside of the trend and this leaves the outlook meanwhile bullish.
  • WTI bulls are lurking within the Fibonacci scale.

Crude prices jumped today after Saudi Arabia said it would cut its crude production by -1.0 million bpd starting in July. However, weaker-than-expected global economic news raised concerns about energy demand, and crude prices fell back from their best levels. WTI is trading back to $74.50 and within the day´s range of between $74.92 and $72.07 the low. The following illustrates the technical outlook at this juncture:

WTI daily chart
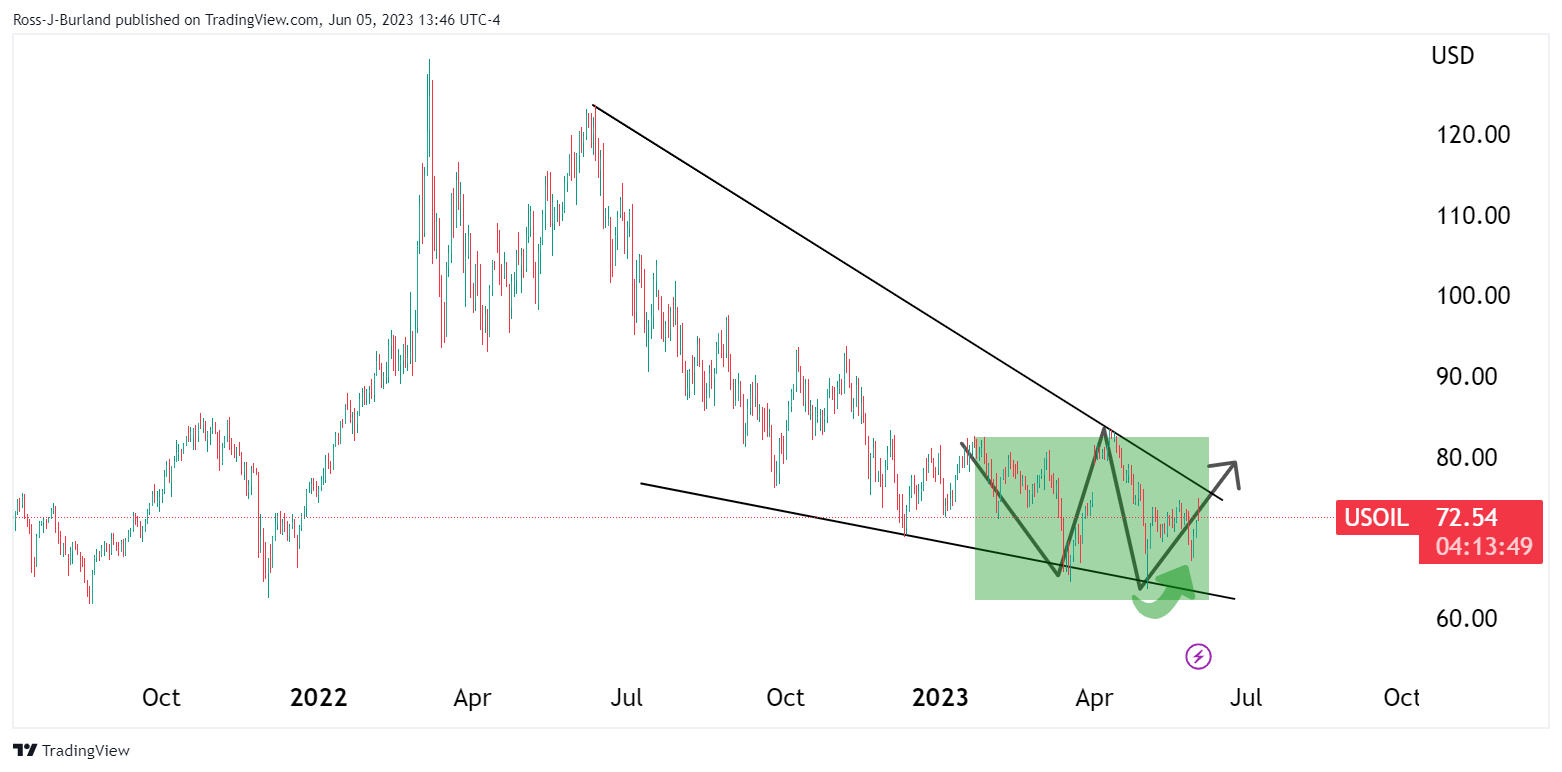
The double bottom is a bullish feature on the longer-term charts with the price coiled within a falling bullish wedge formation. 

WTI H1 chart
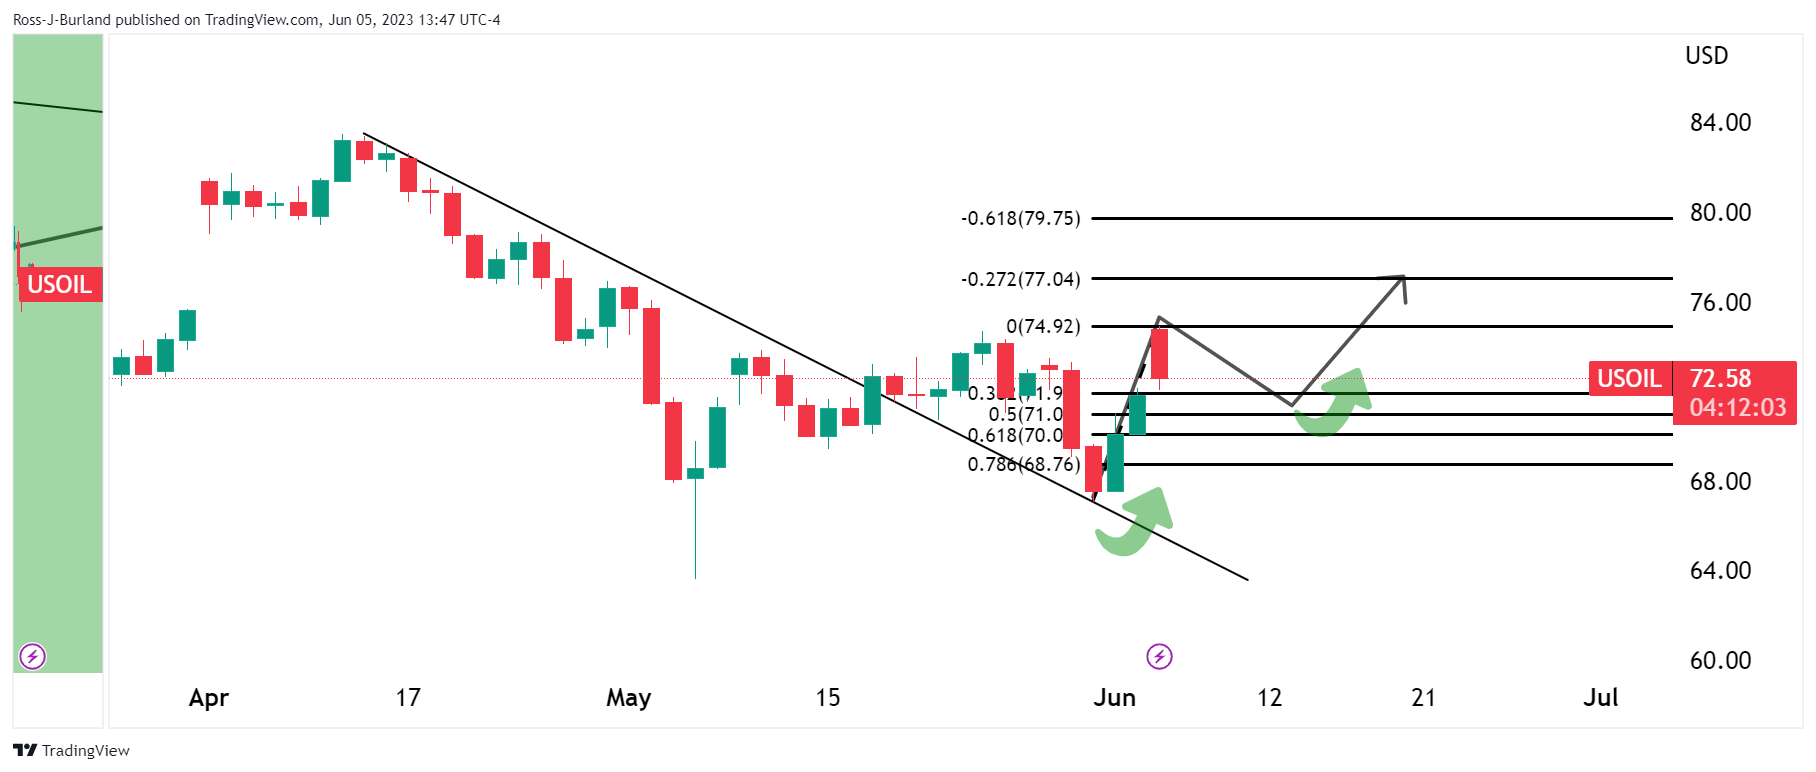
The price has pulled back into the gap but remains on the backside of the prior bearish trendline. This leaves scope for a move up from within the Fibonacci scale in due course. 

Silver Price Analysis: XAG/USD cuts some of its losses back above the 100-DMA

XAG/USD stages a comeback though it remains slightly below its opening price, reclaimed the 100-day Exponential Moving Average (EMA) at $23.47 after h
مزید پڑھیں Previous

Gold Price Forecast: XAU/USD rebounds at the 100-day SMA following US economic data

During Monday’s session, Gold price gained bullish momentum and reached the $1,960 level after bottoming at the 100-day Simple Moving Average at the
مزید پڑھیں Next