Confirming you are not from the U.S. or the Philippines

یہ بیان دے کر، میں واضح طور پر یہ بتاتا اور تصدیق کرتا ہوں کہ:
  • میں امریکی شہری یا رہائشی نہیں ہوں
  • میں فلپائن کا رہائشی نہیں ہوں
  • میں بالواسطہ یا بلاواسطہ امریکی باشندوں کے 10 فیصد سے زیادہ شیئرز/ ووٹنگ کا حق/ امریکی باشندوں کے انٹرسٹ کا مالک نہیں ہوں اور/یا دوسرے ذرائع سے امریکی شہریوں یا رہائشیوں کو کنٹرول نہیں کرتا ہوں۔
  • میں بالواسطہ یا بلاواسطہ امریکی باشندوں کے 10 فیصد سے زیادہ شیئرز/ ووٹنگ کا حق/ انٹرسٹ کا مالک نہیں ہوں اور/ یا کسی دوسرے ذریعے سے امریکی شہری یا رہائشی کے کنٹرول میں نہیں ہوں۔
  • میں FATCA کے سیکشن (a)1504 کے معاملے میں امریکی شہریوں یا رہائشیوں کے ساتھ وابستہ نہیں ہوں
  • میں غلط اعلان کرنے پر اپنی ذمہ داری سے واقف ہوں۔
اس بیان کے مقاصد کے لئے، ریاستہائے متحدہ امریکہ کے تمام منحصر ممالک اور علاقوں کو امریکہ کے مرکزی علاقے کے برابر کردیا گیا ہے۔ میں اپنے اس بیان کی خلاف ورزی سے پیدا ہونے یا اس سے متعلق ہونے والے کسی بھی دعوے کے خلاف، بے ضرر آکٹا مارکیٹس انکارپوریٹڈ، اس کے ڈائریکٹرز اور افسران کا دفاع کرنے کا عہد کرتا ہوں۔
ہم آپ کی رازداری اور آپ کی ذاتی معلومات کے تحفظ کے لیے وقف ہیں۔ ہم محض اپنی پراڈکٹس اور سروسز کے متعلق خصوصی پیشکشوں اور اہم معلومات فراہم کرنے کے لیے ای میلز اکٹھا کرتے ہیں۔ اپنا ای میل ایڈریس دے کر، آپ ہم سے ایسے ای میلز وصول کرنے پر اتفاق کرتے ہیں۔ اگر آپ انسبسکرائب کرنا چاہتے ہیں یا کوئی سوالات یا خدشات ہوں تو، ہماری کسٹمر سپورٹ کو لکھیں۔
Octa trading broker
ٹریڈنگ اکاؤنٹ کھولیں
Back

USD/CAD Price Analysis: Bulls make a move within bearish territory

  • USD/CAD bulls could be starting to make a move.
  • USD/CAD bears eye a downside extension while frontside of the trendline resistance.

The Canadian Dollar strengthened to a nine-month high vs. the Greenback on Thursday and into an area of temporary support as the following technical analysis will illustrate. The rally in the CAD has stemmed from firmer oil prices, recent strength in Canadian data and central bank divergence themes. However, a meanwhile correction is feasible at this juncture when inspecting the daily chart as follows:

USD/CAD daily charts

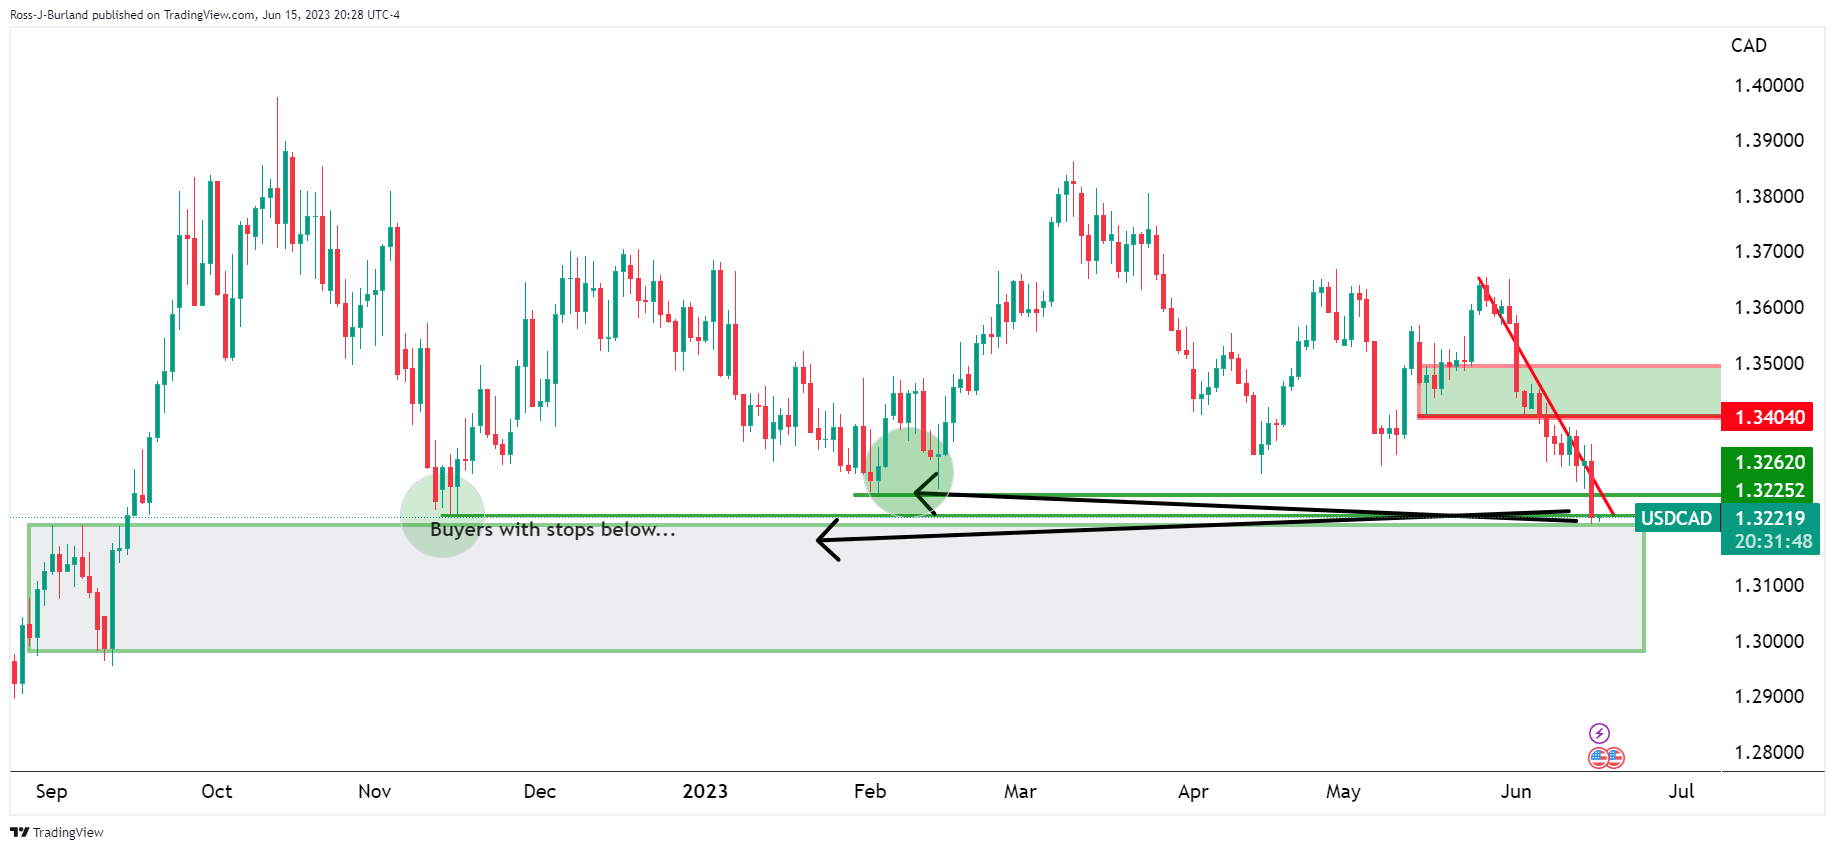
The market has dropped into prior lows and bears are working their way into stop territories.

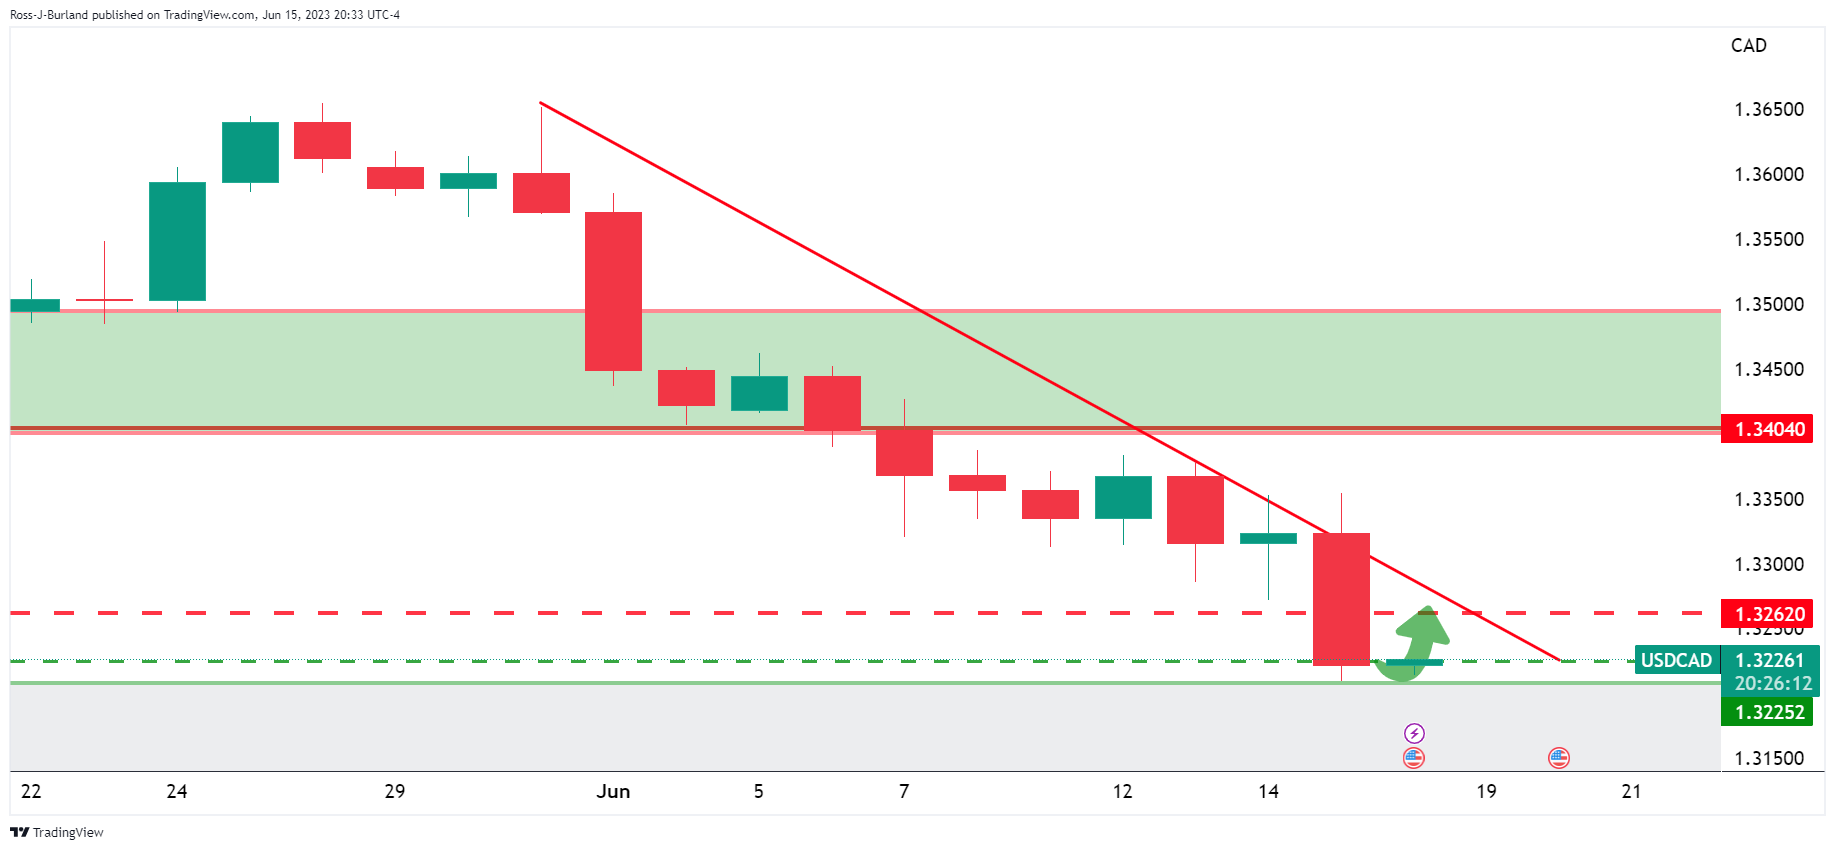
Meanwhile, a temporary correction could be underway at this point with a focusing the trendline resistance:
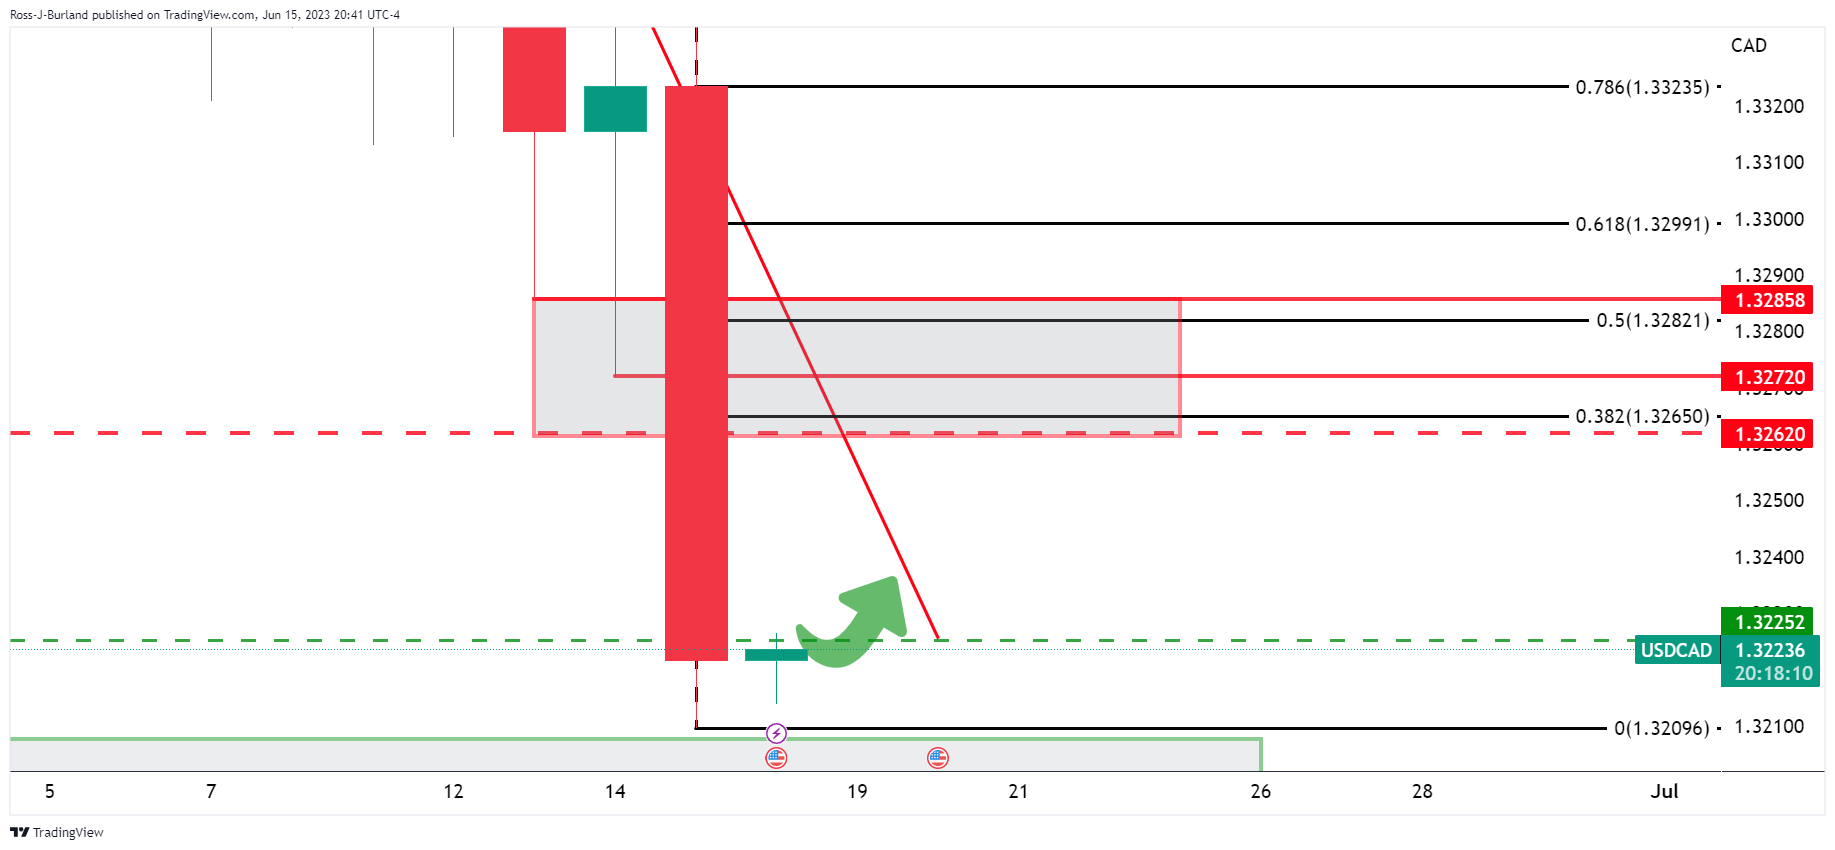
USD/CAD H1 chart

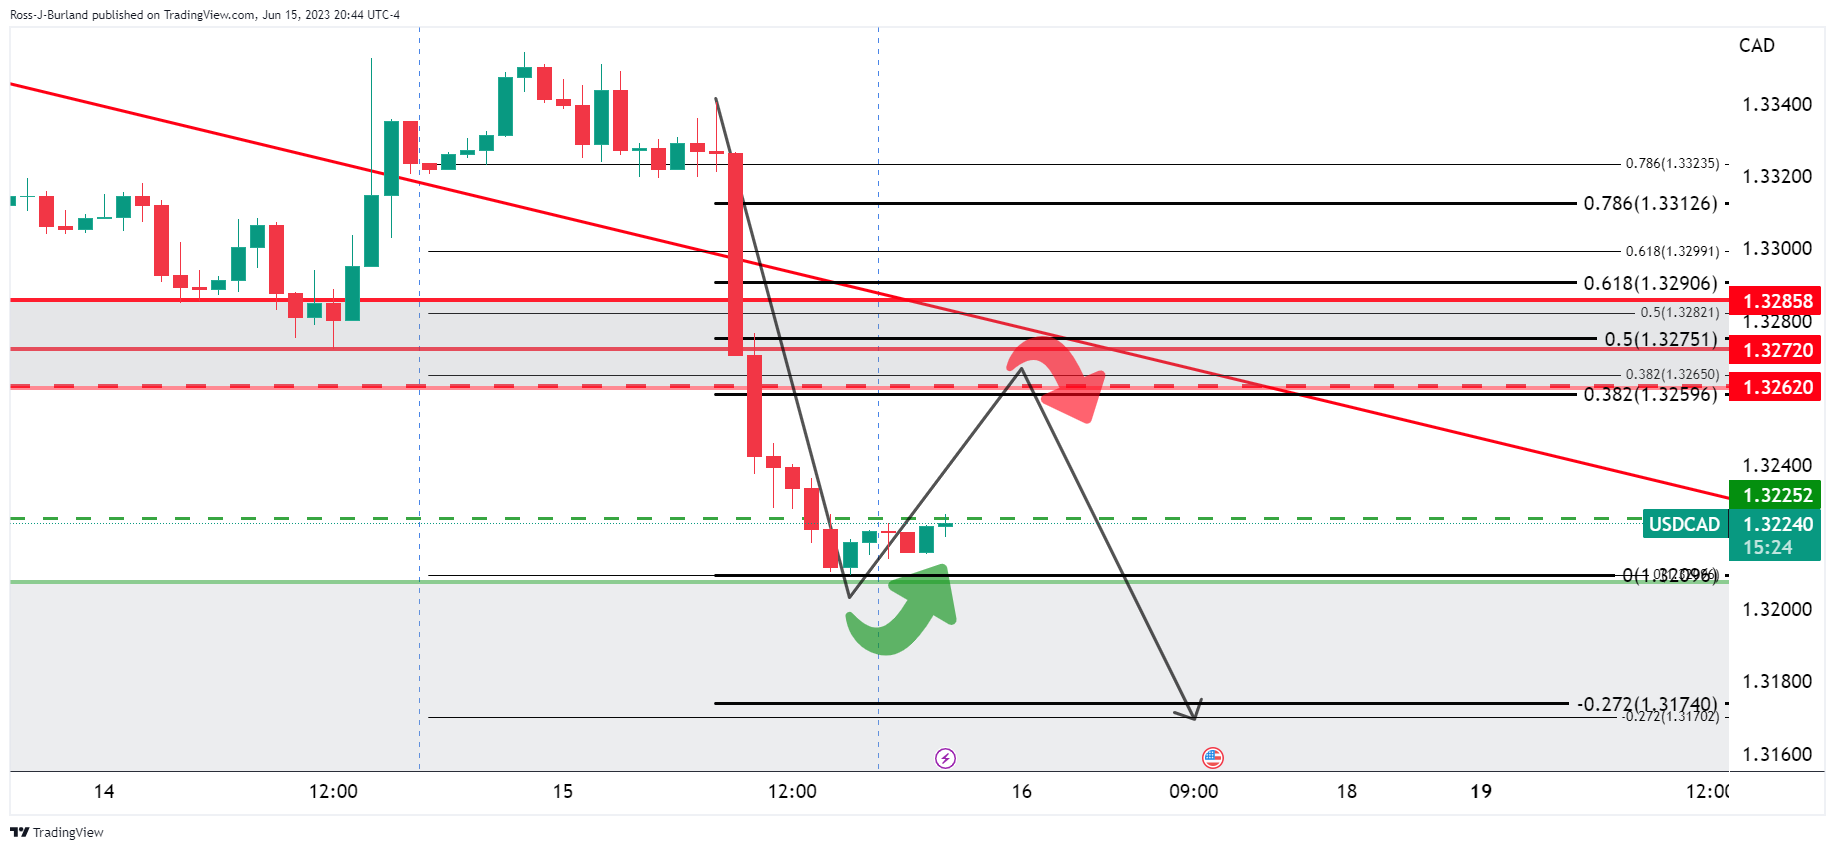
The hourly charts show signs of deceleration and prospects of bullish structure building. 

Natural Gas Price Analysis: XNG/USD retreats from multi-day-old resistance line to around $2.60

Natural Gas Price (XNG/USD) prints the first daily loss in five as it eases from the highest levels in three weeks to $2.60 early Friday. In doing so,
مزید پڑھیں Previous

WTI crude oil steadies below $71.00 as markets stabilize after volatile Thursday

WTI crude oil clings to mild losses around $70.70 as energy traders take a breather after a volatile Thursday. That said, the black gold refreshed wee
مزید پڑھیں Next