Confirming you are not from the U.S. or the Philippines

یہ بیان دے کر، میں واضح طور پر یہ بتاتا اور تصدیق کرتا ہوں کہ:
  • میں امریکی شہری یا رہائشی نہیں ہوں
  • میں فلپائن کا رہائشی نہیں ہوں
  • میں بالواسطہ یا بلاواسطہ امریکی باشندوں کے 10 فیصد سے زیادہ شیئرز/ ووٹنگ کا حق/ امریکی باشندوں کے انٹرسٹ کا مالک نہیں ہوں اور/یا دوسرے ذرائع سے امریکی شہریوں یا رہائشیوں کو کنٹرول نہیں کرتا ہوں۔
  • میں بالواسطہ یا بلاواسطہ امریکی باشندوں کے 10 فیصد سے زیادہ شیئرز/ ووٹنگ کا حق/ انٹرسٹ کا مالک نہیں ہوں اور/ یا کسی دوسرے ذریعے سے امریکی شہری یا رہائشی کے کنٹرول میں نہیں ہوں۔
  • میں FATCA کے سیکشن (a)1504 کے معاملے میں امریکی شہریوں یا رہائشیوں کے ساتھ وابستہ نہیں ہوں
  • میں غلط اعلان کرنے پر اپنی ذمہ داری سے واقف ہوں۔
اس بیان کے مقاصد کے لئے، ریاستہائے متحدہ امریکہ کے تمام منحصر ممالک اور علاقوں کو امریکہ کے مرکزی علاقے کے برابر کردیا گیا ہے۔ میں اپنے اس بیان کی خلاف ورزی سے پیدا ہونے یا اس سے متعلق ہونے والے کسی بھی دعوے کے خلاف، بے ضرر آکٹا مارکیٹس انکارپوریٹڈ، اس کے ڈائریکٹرز اور افسران کا دفاع کرنے کا عہد کرتا ہوں۔
ہم آپ کی رازداری اور آپ کی ذاتی معلومات کے تحفظ کے لیے وقف ہیں۔ ہم محض اپنی پراڈکٹس اور سروسز کے متعلق خصوصی پیشکشوں اور اہم معلومات فراہم کرنے کے لیے ای میلز اکٹھا کرتے ہیں۔ اپنا ای میل ایڈریس دے کر، آپ ہم سے ایسے ای میلز وصول کرنے پر اتفاق کرتے ہیں۔ اگر آپ انسبسکرائب کرنا چاہتے ہیں یا کوئی سوالات یا خدشات ہوں تو، ہماری کسٹمر سپورٹ کو لکھیں۔
Octa trading broker
ٹریڈنگ اکاؤنٹ کھولیں
Back

NZD/JPY Price Analysis: Selling pressure emerges after bearish SMA crossover

  • The NZD/JPY has been trading sideways recently, showing no clear trend.
  • Technical indicators suggest a growing bearish momentum, with the RSI and MACD starting to turn in favor of the sellers.
  • The 100 and 200-day SMA completed a bearish crossover at 92.00.

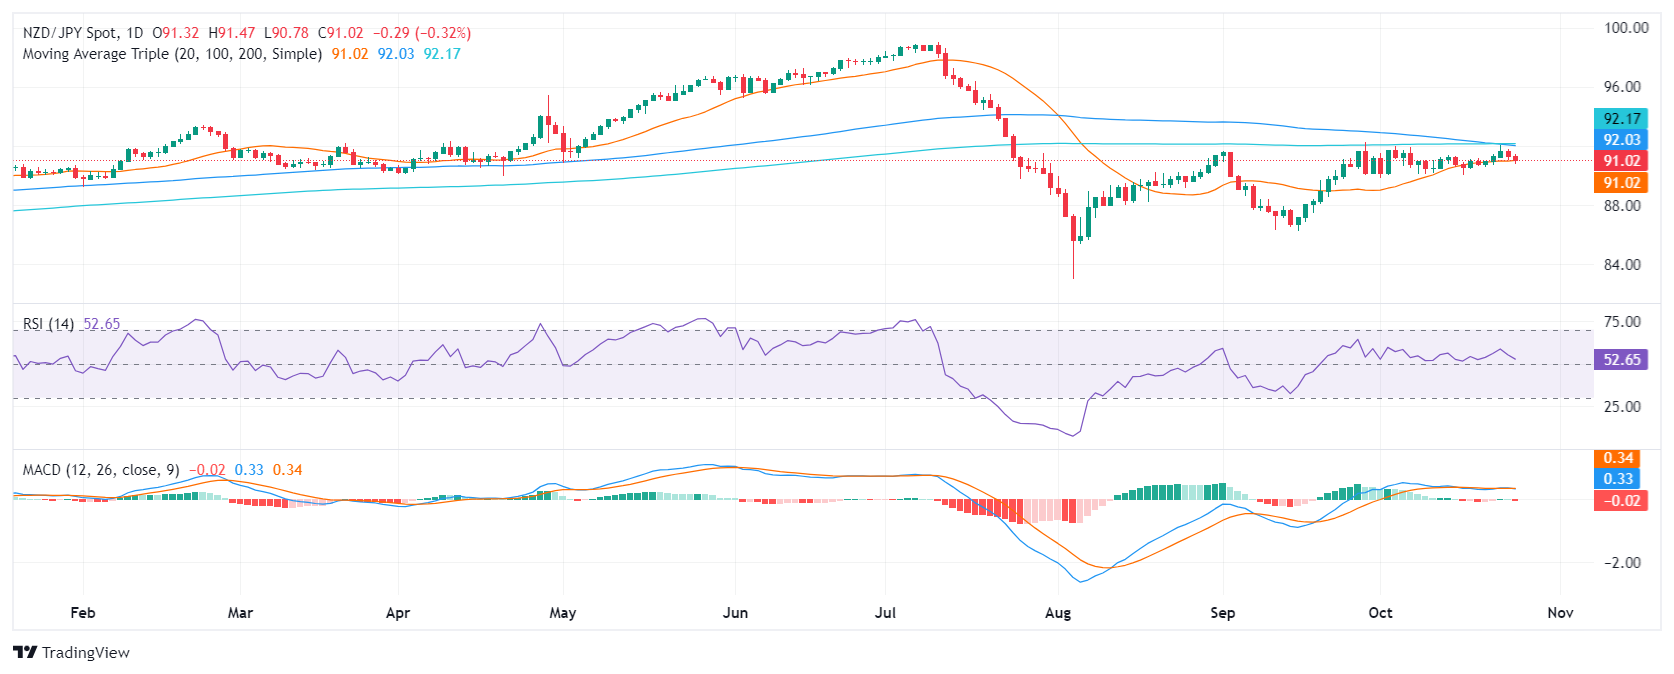
The NZD/JPY pair has traded within a tight range recently, demonstrating a lack of clear directional momentum. However, Friday's session saw a modest decline of 0.32% to 91.00, hinting at a potential shift in sentiment.

Technical indicators align with this observation. The Relative Strength Index (RSI) of 52 suggests that buying pressure is on the wane. Meanwhile, the Moving Average Convergence Divergence (MACD) histogram is red and rising, indicating growing bearish momentum. This divergence between the price action and technical indicators suggests that selling forces may be gaining the upper hand.

It is important to note that the 100 and 200-day Simple Moving Averages (SMAs) have converged and crossed at 92.00, forming a strong resistance level. A break below this confluence could intensify selling pressure and add further downward momentum to the pair. Conversely, a break above this key level could indicate a reversal of the current trend.

NZD/JPY daily chart

Gold holds firm near record high, boosted by tensions in Middle East, US elections

Gold price remains firm ahead of the weekend late in the North American session, up 0.18% after hitting a record high on Wednesday at $2,758.
مزید پڑھیں Previous

NZD/USD Price Analysis: Bears push lower, 0.6000 support gone

The NZD/USD currency pair has extended its downtrend, with bears maintaining a firm grip as selling momentum builds.
مزید پڑھیں Next