Confirming you are not from the U.S. or the Philippines

یہ بیان دے کر، میں واضح طور پر یہ بتاتا اور تصدیق کرتا ہوں کہ:
  • میں امریکی شہری یا رہائشی نہیں ہوں
  • میں فلپائن کا رہائشی نہیں ہوں
  • میں بالواسطہ یا بلاواسطہ امریکی باشندوں کے 10 فیصد سے زیادہ شیئرز/ ووٹنگ کا حق/ امریکی باشندوں کے انٹرسٹ کا مالک نہیں ہوں اور/یا دوسرے ذرائع سے امریکی شہریوں یا رہائشیوں کو کنٹرول نہیں کرتا ہوں۔
  • میں بالواسطہ یا بلاواسطہ امریکی باشندوں کے 10 فیصد سے زیادہ شیئرز/ ووٹنگ کا حق/ انٹرسٹ کا مالک نہیں ہوں اور/ یا کسی دوسرے ذریعے سے امریکی شہری یا رہائشی کے کنٹرول میں نہیں ہوں۔
  • میں FATCA کے سیکشن (a)1504 کے معاملے میں امریکی شہریوں یا رہائشیوں کے ساتھ وابستہ نہیں ہوں
  • میں غلط اعلان کرنے پر اپنی ذمہ داری سے واقف ہوں۔
اس بیان کے مقاصد کے لئے، ریاستہائے متحدہ امریکہ کے تمام منحصر ممالک اور علاقوں کو امریکہ کے مرکزی علاقے کے برابر کردیا گیا ہے۔ میں اپنے اس بیان کی خلاف ورزی سے پیدا ہونے یا اس سے متعلق ہونے والے کسی بھی دعوے کے خلاف، بے ضرر آکٹا مارکیٹس انکارپوریٹڈ، اس کے ڈائریکٹرز اور افسران کا دفاع کرنے کا عہد کرتا ہوں۔
ہم آپ کی رازداری اور آپ کی ذاتی معلومات کے تحفظ کے لیے وقف ہیں۔ ہم محض اپنی پراڈکٹس اور سروسز کے متعلق خصوصی پیشکشوں اور اہم معلومات فراہم کرنے کے لیے ای میلز اکٹھا کرتے ہیں۔ اپنا ای میل ایڈریس دے کر، آپ ہم سے ایسے ای میلز وصول کرنے پر اتفاق کرتے ہیں۔ اگر آپ انسبسکرائب کرنا چاہتے ہیں یا کوئی سوالات یا خدشات ہوں تو، ہماری کسٹمر سپورٹ کو لکھیں۔
Octa trading broker
ٹریڈنگ اکاؤنٹ کھولیں
Back

NZD/JPY Price Analysis: Bullish momentum resumes after sideways consolidation

  • NZD/JPY has dropped to 91.50 in Tuesday's session, signaling a mild bearish turn.
  • Technical indicators show a neutral outlook, with the RSI starting to slow down but remaining in positive territory.

NZD/JPY has reversed its upward trajectory after a period of sideways consolidation. In Tuesday's session, the pair declined mildly to 91.50, suggesting a potential shift in market sentiment. However, its unlikely that Tuesday’s movements are a trend shift as the pair continues stuck between the 20-day Simple Moving Average and the 92.00 threshold.

The Relative Strength Index (RSI) has slid from 57, indicating that buying pressure is decreasing. Meanwhile the MACD is showing flat momentum with a neutral histogram and a declining signal line. This change in the signal line could point a potential bearish momentum in the price.

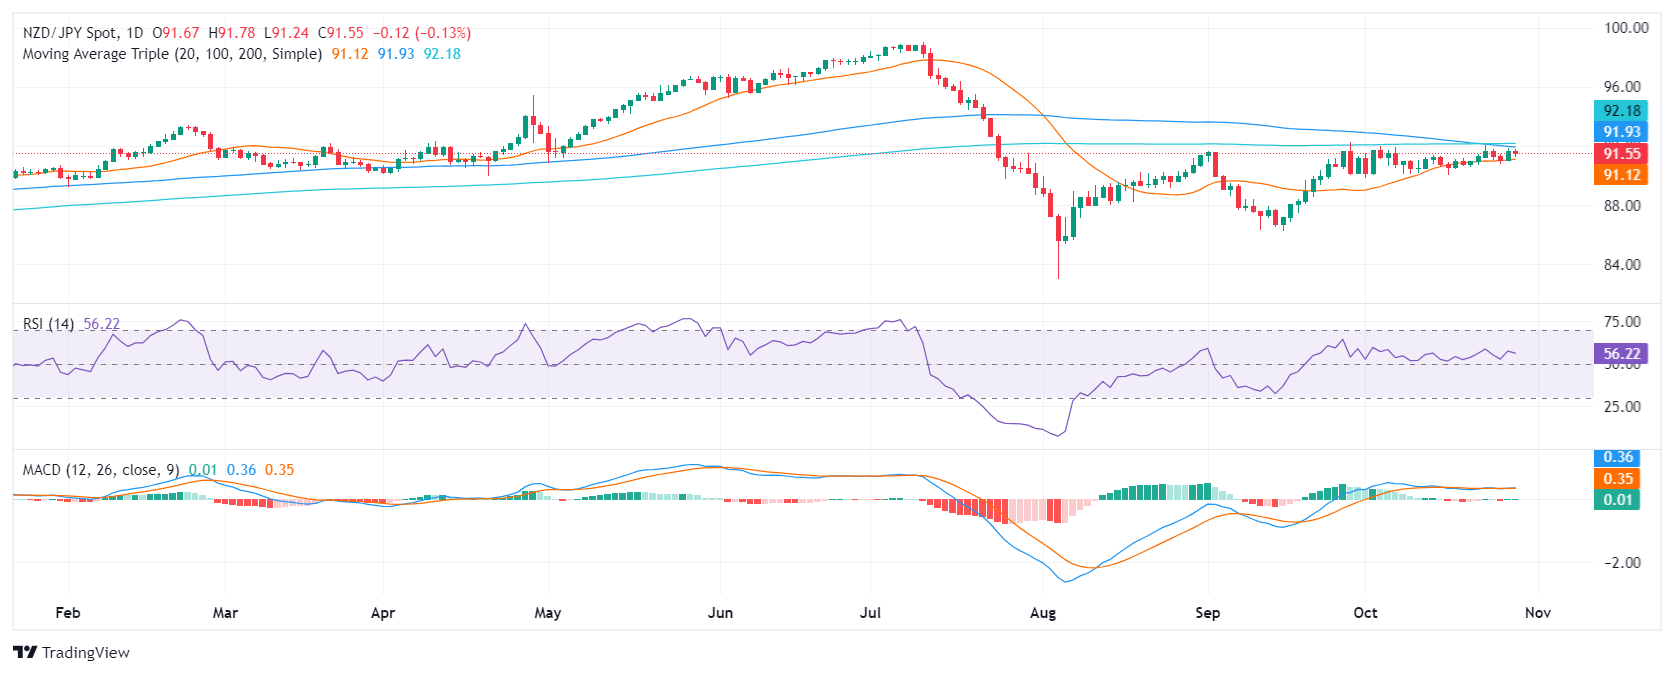
The pair has been trading sideways over the past sessions, within a narrow range defined by support at around 90.70 (20-day SMA) and resistance at 92.20.The 20-day SMA serves as a critical support level that could trigger stronger selling pressure if breached while the 100 and 200-day SMA convergence around 92.00 is the resistances to be breached which could improve the outlook.

NZD/JPY daily chart

Gold hits record high above $2,770 amid geopolitical tensions

Gold hit a new all-time high (ATH) of $2,774 late in the North American session amid a risk-on mood and a retracement in US Treasury yields.
مزید پڑھیں Previous

EUR/USD trades with mild gains above 1.0800, eyes on US/Eurozone GDP, German inflation data

The EUR/USD pair recovers to around 1.0820 during the early Asian session on Wednesday.
مزید پڑھیں Next