Confirming you are not from the U.S. or the Philippines

یہ بیان دے کر، میں واضح طور پر یہ بتاتا اور تصدیق کرتا ہوں کہ:
  • میں امریکی شہری یا رہائشی نہیں ہوں
  • میں فلپائن کا رہائشی نہیں ہوں
  • میں بالواسطہ یا بلاواسطہ امریکی باشندوں کے 10 فیصد سے زیادہ شیئرز/ ووٹنگ کا حق/ امریکی باشندوں کے انٹرسٹ کا مالک نہیں ہوں اور/یا دوسرے ذرائع سے امریکی شہریوں یا رہائشیوں کو کنٹرول نہیں کرتا ہوں۔
  • میں بالواسطہ یا بلاواسطہ امریکی باشندوں کے 10 فیصد سے زیادہ شیئرز/ ووٹنگ کا حق/ انٹرسٹ کا مالک نہیں ہوں اور/ یا کسی دوسرے ذریعے سے امریکی شہری یا رہائشی کے کنٹرول میں نہیں ہوں۔
  • میں FATCA کے سیکشن (a)1504 کے معاملے میں امریکی شہریوں یا رہائشیوں کے ساتھ وابستہ نہیں ہوں
  • میں غلط اعلان کرنے پر اپنی ذمہ داری سے واقف ہوں۔
اس بیان کے مقاصد کے لئے، ریاستہائے متحدہ امریکہ کے تمام منحصر ممالک اور علاقوں کو امریکہ کے مرکزی علاقے کے برابر کردیا گیا ہے۔ میں اپنے اس بیان کی خلاف ورزی سے پیدا ہونے یا اس سے متعلق ہونے والے کسی بھی دعوے کے خلاف، بے ضرر آکٹا مارکیٹس انکارپوریٹڈ، اس کے ڈائریکٹرز اور افسران کا دفاع کرنے کا عہد کرتا ہوں۔
ہم آپ کی رازداری اور آپ کی ذاتی معلومات کے تحفظ کے لیے وقف ہیں۔ ہم محض اپنی پراڈکٹس اور سروسز کے متعلق خصوصی پیشکشوں اور اہم معلومات فراہم کرنے کے لیے ای میلز اکٹھا کرتے ہیں۔ اپنا ای میل ایڈریس دے کر، آپ ہم سے ایسے ای میلز وصول کرنے پر اتفاق کرتے ہیں۔ اگر آپ انسبسکرائب کرنا چاہتے ہیں یا کوئی سوالات یا خدشات ہوں تو، ہماری کسٹمر سپورٹ کو لکھیں۔
Octa trading broker
ٹریڈنگ اکاؤنٹ کھولیں
Test
Back

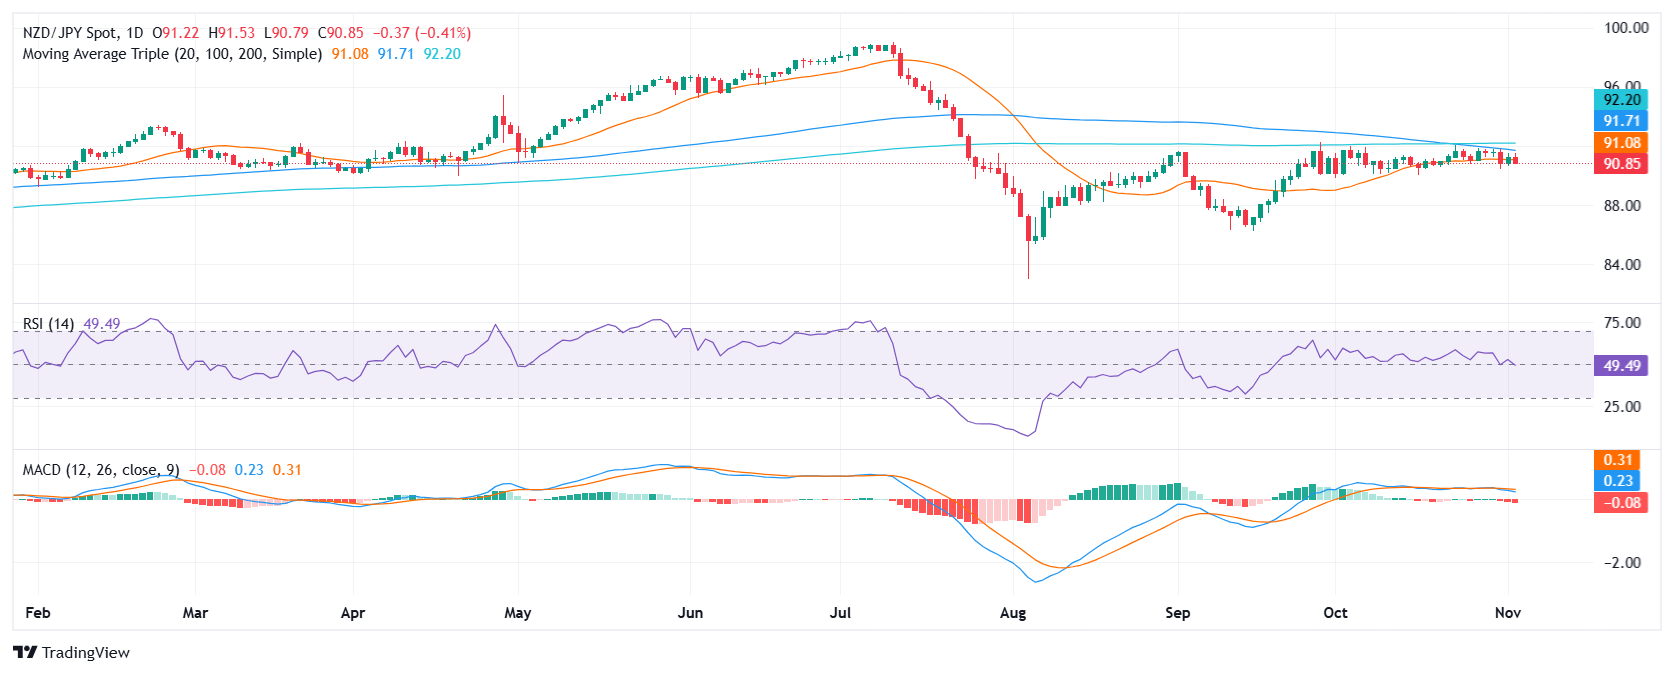
NZD/JPY Price Analysis: Selling pressure intensifies, 20-day SMA under attack

  • NZD/JPY extended its decline on Monday, dropping to 90.90.
  • Technical indicators suggest a bearish outlook, with increasing selling pressure and a declining RSI.
  • The 20-day SMA is the last barrier against the sellers.

The NZD/JPY’s recent sideways movement seems to be ending, as the pair resumed its decline and fell slightly below the 20-day Simple Moving Average (SMA), below 91.00 on Monday. 

The Moving Average Convergence Divergence (MACD) indicator shows rising red bars, indicating increasing bearish momentum while the Relative Strength Index (RSI) is below 50, with a declining slope, also suggesting a bearish outlook.

The selling pressure is likely to continue, with potential support levels at 90.50, 90.00, and 89.50. If the pair breaks below 90.50, it could signal further decline. On the other hand, a close above 91.50 resistance could indicate a trend reversal. However, the overall outlook remains bearish, as the MACD and RSI indicators suggest strong selling pressure. In addition, the 100-day SMA is looming near the 20-day average and in case of completing a bearish crossover more selling pressure should be expected.

NZD/JPY daily chart

South Korea FX Reserves: 415.7B (October) vs previous 419.97B

South Korea FX Reserves: 415.7B (October) vs previous 419.97B
مزید پڑھیں Previous

RBA expected to keep interest rate on hold amid sticky inflation and tight labor market conditions

The Reserve Bank of Australia (RBA) is expected to sit tight yet again on its monetary policy, extending the pause into the eighth straight meeting on Tuesday.
مزید پڑھیں Next