Confirming you are not from the U.S. or the Philippines

یہ بیان دے کر، میں واضح طور پر یہ بتاتا اور تصدیق کرتا ہوں کہ:
  • میں امریکی شہری یا رہائشی نہیں ہوں
  • میں فلپائن کا رہائشی نہیں ہوں
  • میں بالواسطہ یا بلاواسطہ امریکی باشندوں کے 10 فیصد سے زیادہ شیئرز/ ووٹنگ کا حق/ امریکی باشندوں کے انٹرسٹ کا مالک نہیں ہوں اور/یا دوسرے ذرائع سے امریکی شہریوں یا رہائشیوں کو کنٹرول نہیں کرتا ہوں۔
  • میں بالواسطہ یا بلاواسطہ امریکی باشندوں کے 10 فیصد سے زیادہ شیئرز/ ووٹنگ کا حق/ انٹرسٹ کا مالک نہیں ہوں اور/ یا کسی دوسرے ذریعے سے امریکی شہری یا رہائشی کے کنٹرول میں نہیں ہوں۔
  • میں FATCA کے سیکشن (a)1504 کے معاملے میں امریکی شہریوں یا رہائشیوں کے ساتھ وابستہ نہیں ہوں
  • میں غلط اعلان کرنے پر اپنی ذمہ داری سے واقف ہوں۔
اس بیان کے مقاصد کے لئے، ریاستہائے متحدہ امریکہ کے تمام منحصر ممالک اور علاقوں کو امریکہ کے مرکزی علاقے کے برابر کردیا گیا ہے۔ میں اپنے اس بیان کی خلاف ورزی سے پیدا ہونے یا اس سے متعلق ہونے والے کسی بھی دعوے کے خلاف، بے ضرر آکٹا مارکیٹس انکارپوریٹڈ، اس کے ڈائریکٹرز اور افسران کا دفاع کرنے کا عہد کرتا ہوں۔
ہم آپ کی رازداری اور آپ کی ذاتی معلومات کے تحفظ کے لیے وقف ہیں۔ ہم محض اپنی پراڈکٹس اور سروسز کے متعلق خصوصی پیشکشوں اور اہم معلومات فراہم کرنے کے لیے ای میلز اکٹھا کرتے ہیں۔ اپنا ای میل ایڈریس دے کر، آپ ہم سے ایسے ای میلز وصول کرنے پر اتفاق کرتے ہیں۔ اگر آپ انسبسکرائب کرنا چاہتے ہیں یا کوئی سوالات یا خدشات ہوں تو، ہماری کسٹمر سپورٹ کو لکھیں۔
Octa trading broker
ٹریڈنگ اکاؤنٹ کھولیں
Back

USD/JPY Technical Analysis: Sellers continue to lurk ahead of 110.00

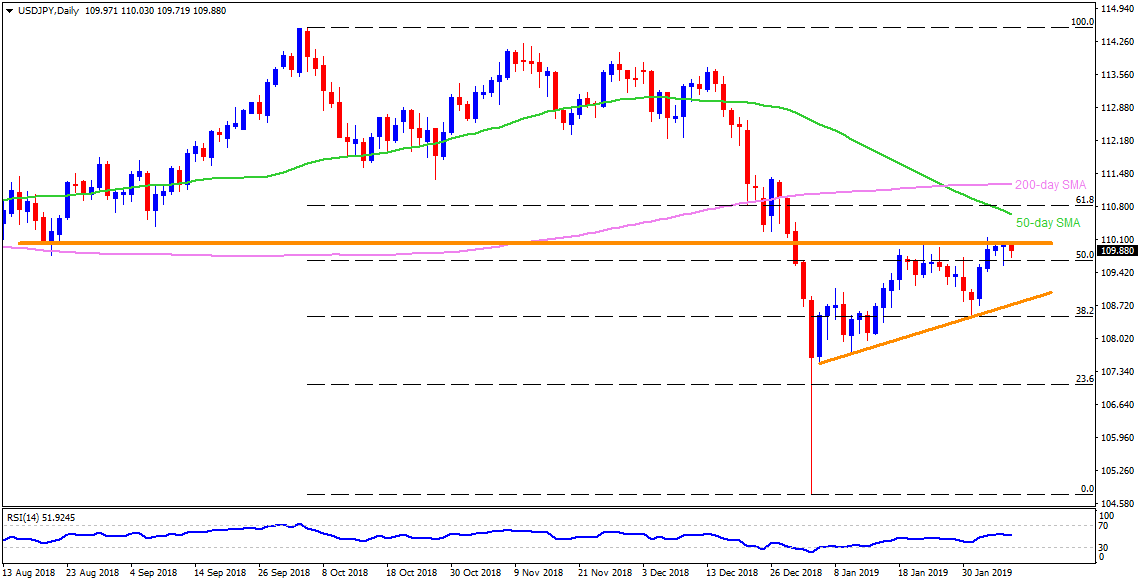
USD/JPY daily chart

  • A horizontal-line connecting August 2018 closing lows to the highs marked during 2019 so far restricts USD/JPY upside around 110.00 on early Thursday.
  • As a result, chances of the pair’s pullback to the 109.10 and then to the 108.70 support-line can’t be denied.
  • On the flip side, a daily closing beyond 110.00 can trigger an upside towards 50-day simple moving average (SMA) level of 110.65 prior to highlighting 111.25, including 200-day SMA, as resistance.
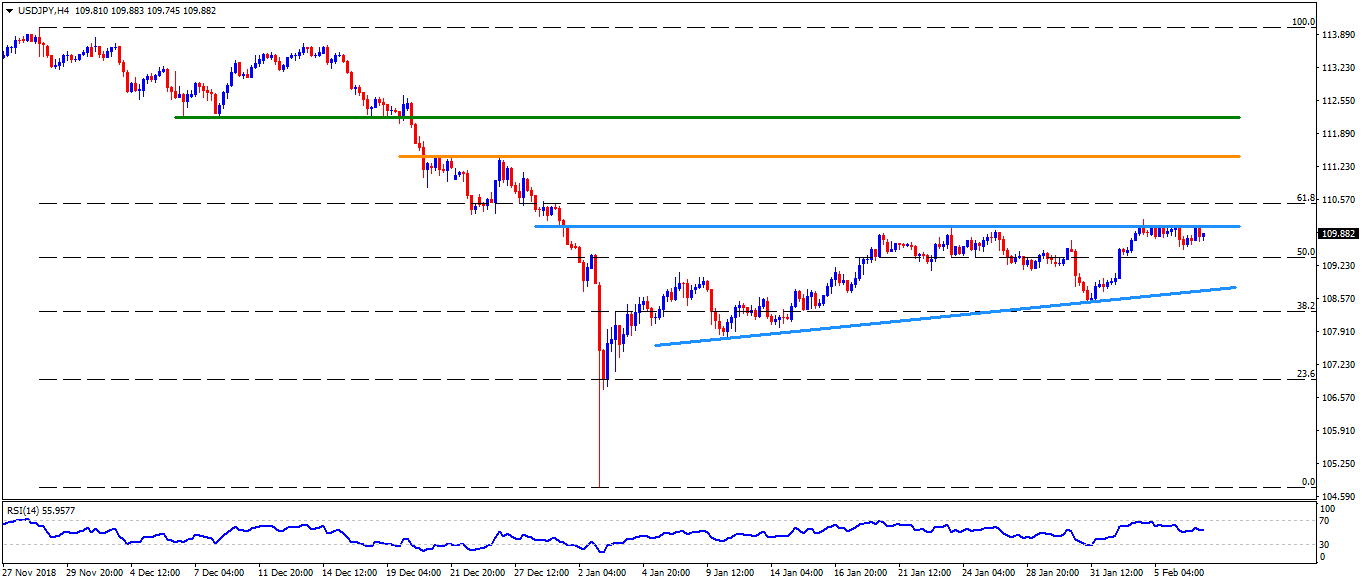
USD/JPY 4-hour chart

  • On the shorter time frame, 109.50 can offer immediate support ahead of shifting focus to the 109.10 and then to the 108.70.
  • If there prevail additional downside pressure after 108.70, then 108.50 and 107.70 could regain market attention.
  • Meanwhile, 61.8% Fibonacci Retracement of its recent declines, around 110.50, acts as adjacent resistance for the pair once it clears the 110.00 barrier.
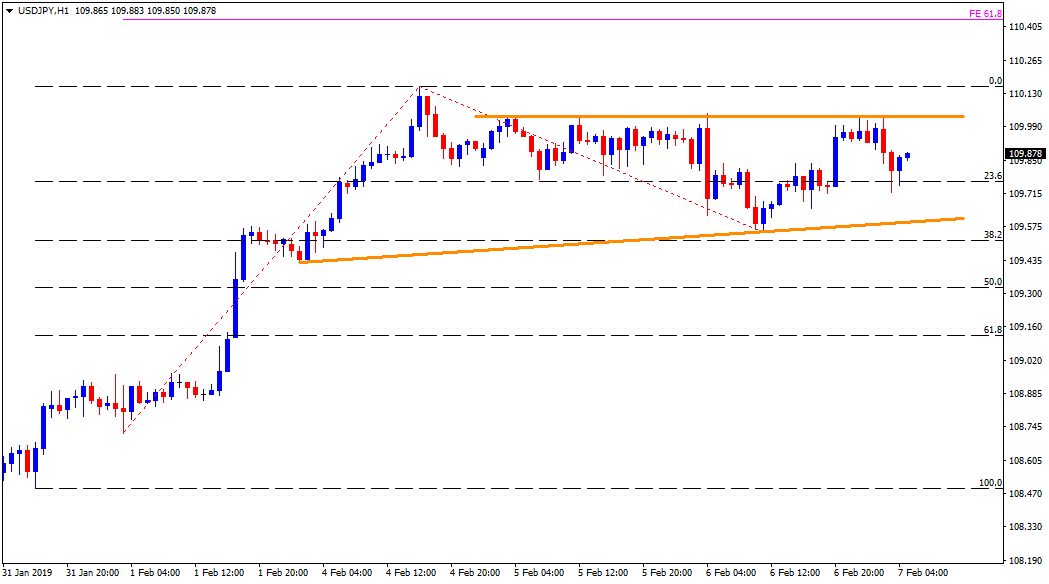
USD/JPY Hourly chart

  • The 109.60 and the 110.00 restricts the pair’s near-term moves with 109.50 and the 110.15 being follow-on levels to observe on either side breaks.
  • The 61.8% Fibonacci expansion on latest pullback, at 110.45 can please buyers after 110.15 while 109.50 and 109.10 seem sellers’ bets past-109.60.
USD/INR Technical Analysis: 100-day MA is key resistance

The USD/INR pair closed at 71.44 on Feb. 1, confirming a bull flag breakout. The 100-day moving average (MA), however, has put the brakes on the post-
مزید پڑھیں Previous

White House Chief of staff Mulvaney: Will figure out wall if Congress says no - Fox

Acting White House chief of staff Mick Mulvaney is out on the wires reiterating that President Trump will figure out ways to construct a wall across M
مزید پڑھیں Next