Confirming you are not from the U.S. or the Philippines

یہ بیان دے کر، میں واضح طور پر یہ بتاتا اور تصدیق کرتا ہوں کہ:
  • میں امریکی شہری یا رہائشی نہیں ہوں
  • میں فلپائن کا رہائشی نہیں ہوں
  • میں بالواسطہ یا بلاواسطہ امریکی باشندوں کے 10 فیصد سے زیادہ شیئرز/ ووٹنگ کا حق/ امریکی باشندوں کے انٹرسٹ کا مالک نہیں ہوں اور/یا دوسرے ذرائع سے امریکی شہریوں یا رہائشیوں کو کنٹرول نہیں کرتا ہوں۔
  • میں بالواسطہ یا بلاواسطہ امریکی باشندوں کے 10 فیصد سے زیادہ شیئرز/ ووٹنگ کا حق/ انٹرسٹ کا مالک نہیں ہوں اور/ یا کسی دوسرے ذریعے سے امریکی شہری یا رہائشی کے کنٹرول میں نہیں ہوں۔
  • میں FATCA کے سیکشن (a)1504 کے معاملے میں امریکی شہریوں یا رہائشیوں کے ساتھ وابستہ نہیں ہوں
  • میں غلط اعلان کرنے پر اپنی ذمہ داری سے واقف ہوں۔
اس بیان کے مقاصد کے لئے، ریاستہائے متحدہ امریکہ کے تمام منحصر ممالک اور علاقوں کو امریکہ کے مرکزی علاقے کے برابر کردیا گیا ہے۔ میں اپنے اس بیان کی خلاف ورزی سے پیدا ہونے یا اس سے متعلق ہونے والے کسی بھی دعوے کے خلاف، بے ضرر آکٹا مارکیٹس انکارپوریٹڈ، اس کے ڈائریکٹرز اور افسران کا دفاع کرنے کا عہد کرتا ہوں۔
ہم آپ کی رازداری اور آپ کی ذاتی معلومات کے تحفظ کے لیے وقف ہیں۔ ہم محض اپنی پراڈکٹس اور سروسز کے متعلق خصوصی پیشکشوں اور اہم معلومات فراہم کرنے کے لیے ای میلز اکٹھا کرتے ہیں۔ اپنا ای میل ایڈریس دے کر، آپ ہم سے ایسے ای میلز وصول کرنے پر اتفاق کرتے ہیں۔ اگر آپ انسبسکرائب کرنا چاہتے ہیں یا کوئی سوالات یا خدشات ہوں تو، ہماری کسٹمر سپورٹ کو لکھیں۔
Octa trading broker
ٹریڈنگ اکاؤنٹ کھولیں
Back

AUD/JPY Technical Analysis: 79.80/90 - a tough nut to crack

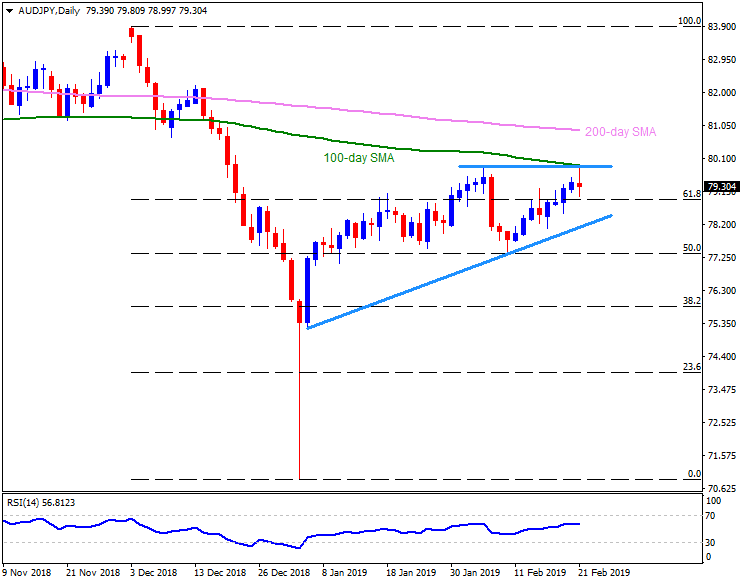
AUD/JPY daily chart

  • AUD/JPY trades near 79.30 during early Thursday.
  • The pair witnessed pullback from the 79.80-90 region, comprising 100-day simple moving average (SMA) and early month high.
  • Buyers need to conquer the 79.90 in order to aim for 200-day SMA level of 80.90 and then 82.20 numbers.
  • In case sellers manage to rule, 61.8% Fibonacci retracement of December to January decline, at 78.90 can become their immediate favorite.
  • Though, an upward sloping trend-line at 78.10, may challenge the downturn, if not then 50% Fibonacci around 77.50 may mark its presence on the chart.
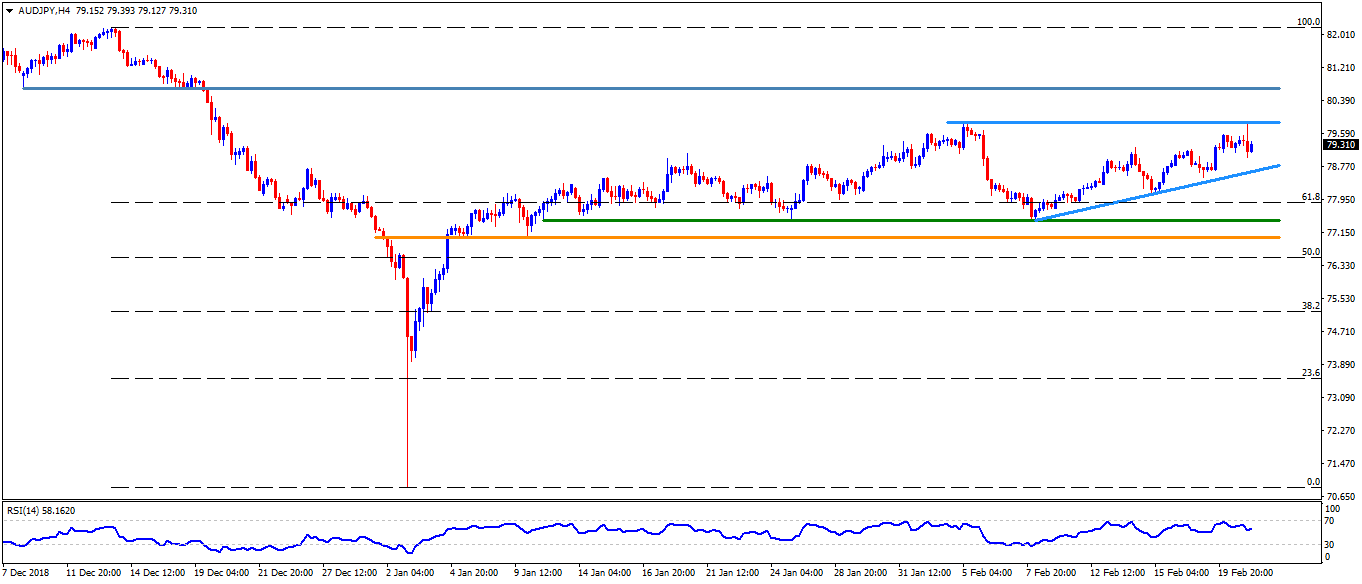
AUD/JPY 4-Hour chart

  • On H4 chart, the 80.70 can offer an intermediate halt to the pair’s rise past-79.90 whereas 81.20 and 81.65 can please the bulls ahead of 82.20.
  • Alternatively, adjacent support-line at 78.55 may offer nearby rest to the pair between 78.90 and 78.10 while 77.50 and 77.00 could flash on sellers radar afterward.
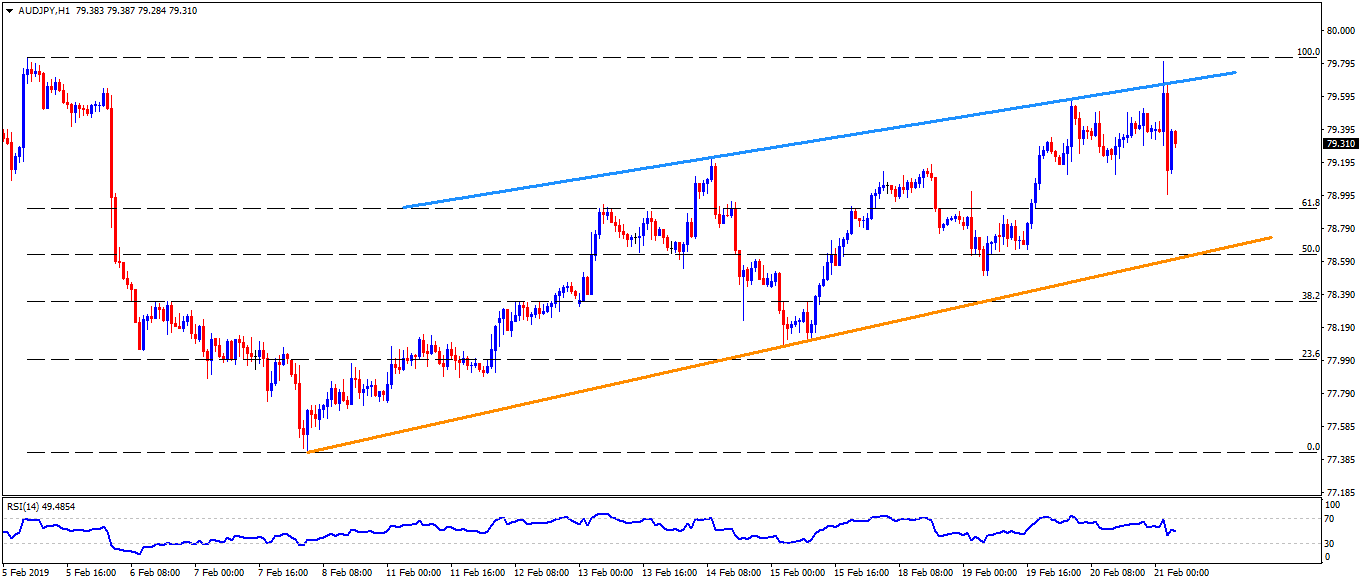
AUD/JPY hourly chart

  • An ascending trend-line connecting high marked on February 14 and 20, at 79.70, may become immediate resistance for the pair ahead of highlighting the 79.80-90 area.
  • Meanwhile 61.8% Fibonacci retracement of its decline during the first week of the month, at 78.90 and an upward sloping trend-line, at 78.55, might act as adjacent supports for the pair.
Gold Technical Analysis: Pullback to ascending 5-day MA likely

Gold is currently trading at $1,340, having clocked a high of $1,346.85 yesterday.  On the daily chart, the safe haven yellow metal carved out a doji
مزید پڑھیں Previous

USD/INR Technical Analysis: 100-day MA is again reversing bounce

USD/INR is currently trading at 71.00, having failed to take out the 100-day moving average (MA)  in the previous two days.  Daily chart As seen a
مزید پڑھیں Next