Confirming you are not from the U.S. or the Philippines

یہ بیان دے کر، میں واضح طور پر یہ بتاتا اور تصدیق کرتا ہوں کہ:
  • میں امریکی شہری یا رہائشی نہیں ہوں
  • میں فلپائن کا رہائشی نہیں ہوں
  • میں بالواسطہ یا بلاواسطہ امریکی باشندوں کے 10 فیصد سے زیادہ شیئرز/ ووٹنگ کا حق/ امریکی باشندوں کے انٹرسٹ کا مالک نہیں ہوں اور/یا دوسرے ذرائع سے امریکی شہریوں یا رہائشیوں کو کنٹرول نہیں کرتا ہوں۔
  • میں بالواسطہ یا بلاواسطہ امریکی باشندوں کے 10 فیصد سے زیادہ شیئرز/ ووٹنگ کا حق/ انٹرسٹ کا مالک نہیں ہوں اور/ یا کسی دوسرے ذریعے سے امریکی شہری یا رہائشی کے کنٹرول میں نہیں ہوں۔
  • میں FATCA کے سیکشن (a)1504 کے معاملے میں امریکی شہریوں یا رہائشیوں کے ساتھ وابستہ نہیں ہوں
  • میں غلط اعلان کرنے پر اپنی ذمہ داری سے واقف ہوں۔
اس بیان کے مقاصد کے لئے، ریاستہائے متحدہ امریکہ کے تمام منحصر ممالک اور علاقوں کو امریکہ کے مرکزی علاقے کے برابر کردیا گیا ہے۔ میں اپنے اس بیان کی خلاف ورزی سے پیدا ہونے یا اس سے متعلق ہونے والے کسی بھی دعوے کے خلاف، بے ضرر آکٹا مارکیٹس انکارپوریٹڈ، اس کے ڈائریکٹرز اور افسران کا دفاع کرنے کا عہد کرتا ہوں۔
ہم آپ کی رازداری اور آپ کی ذاتی معلومات کے تحفظ کے لیے وقف ہیں۔ ہم محض اپنی پراڈکٹس اور سروسز کے متعلق خصوصی پیشکشوں اور اہم معلومات فراہم کرنے کے لیے ای میلز اکٹھا کرتے ہیں۔ اپنا ای میل ایڈریس دے کر، آپ ہم سے ایسے ای میلز وصول کرنے پر اتفاق کرتے ہیں۔ اگر آپ انسبسکرائب کرنا چاہتے ہیں یا کوئی سوالات یا خدشات ہوں تو، ہماری کسٹمر سپورٹ کو لکھیں۔
Octa trading broker
ٹریڈنگ اکاؤنٹ کھولیں
Back

US Dollar Index technical analysis: DXY breaks to 4-day high and hits 98.68 level in the New York session

  • DXY (US Dollar Index) breaks the 98.55 level to the upside.
  • The level to beat for buyers is at the 98.68 resistance level.
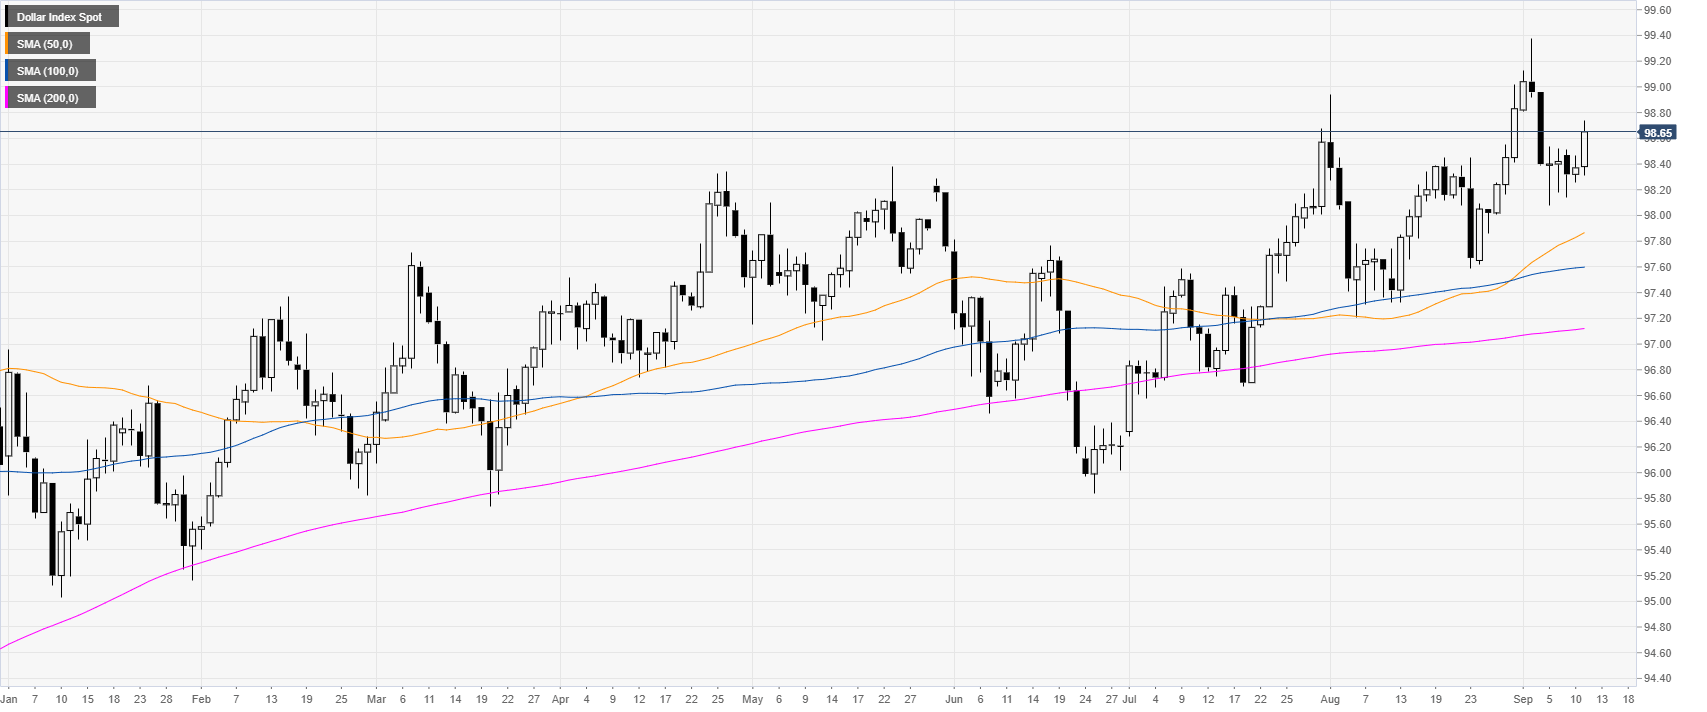


DXY daily chart


DXY (US Dollar Index) is trading in a bull trend above the main daily simple moving averages (DSMAs). The Greenback is picking up some steam as the 10-year US Bond Yields are trading at 3-week’s high. 
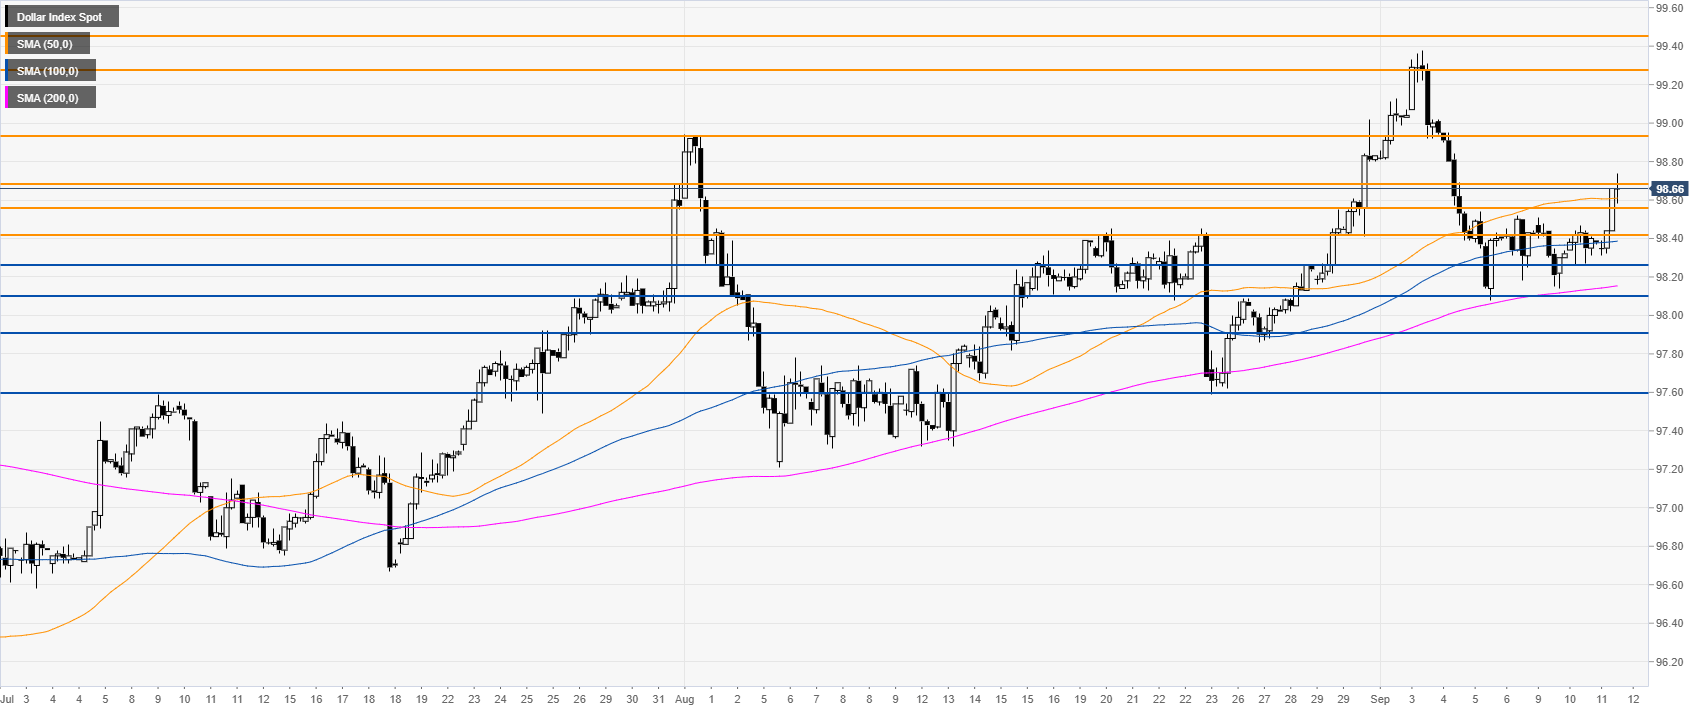
 

DXY four-hour chart


The US dollar Index broke above the 98.55 resistance and hit the 98.68 level this Thursday. As the market trades above its main SMAs, DXY might continue climbing towards 98.94 resistance level. If the bulls gather enough steam they could reach 99.28 resistance near the 2019 high.


DXY 30-minute chart


DXY is trading above its main SMAs, suggesting bullish momentum in the near term. Immediate support is seen at the 98.55 and 98.42 price levels.


Additional key levels


WTI trades below $58 despite larger-than-expected draw in US crude oil stocks

Crude oil prices struggled to capitalize on the Energy Information Administration's (EIA) weekly oil market report and the barrel of West Texas Interm
مزید پڑھیں Previous

USD/CAD climbs to daily highs above 1.3180 on oil sell-off

The USD/CAD pair gained traction in the last hour and rose to its highest level of the day at 1.3182 as the falling crude oil prices weighed on the co
مزید پڑھیں Next