Confirming you are not from the U.S. or the Philippines

یہ بیان دے کر، میں واضح طور پر یہ بتاتا اور تصدیق کرتا ہوں کہ:
  • میں امریکی شہری یا رہائشی نہیں ہوں
  • میں فلپائن کا رہائشی نہیں ہوں
  • میں بالواسطہ یا بلاواسطہ امریکی باشندوں کے 10 فیصد سے زیادہ شیئرز/ ووٹنگ کا حق/ امریکی باشندوں کے انٹرسٹ کا مالک نہیں ہوں اور/یا دوسرے ذرائع سے امریکی شہریوں یا رہائشیوں کو کنٹرول نہیں کرتا ہوں۔
  • میں بالواسطہ یا بلاواسطہ امریکی باشندوں کے 10 فیصد سے زیادہ شیئرز/ ووٹنگ کا حق/ انٹرسٹ کا مالک نہیں ہوں اور/ یا کسی دوسرے ذریعے سے امریکی شہری یا رہائشی کے کنٹرول میں نہیں ہوں۔
  • میں FATCA کے سیکشن (a)1504 کے معاملے میں امریکی شہریوں یا رہائشیوں کے ساتھ وابستہ نہیں ہوں
  • میں غلط اعلان کرنے پر اپنی ذمہ داری سے واقف ہوں۔
اس بیان کے مقاصد کے لئے، ریاستہائے متحدہ امریکہ کے تمام منحصر ممالک اور علاقوں کو امریکہ کے مرکزی علاقے کے برابر کردیا گیا ہے۔ میں اپنے اس بیان کی خلاف ورزی سے پیدا ہونے یا اس سے متعلق ہونے والے کسی بھی دعوے کے خلاف، بے ضرر آکٹا مارکیٹس انکارپوریٹڈ، اس کے ڈائریکٹرز اور افسران کا دفاع کرنے کا عہد کرتا ہوں۔
ہم آپ کی رازداری اور آپ کی ذاتی معلومات کے تحفظ کے لیے وقف ہیں۔ ہم محض اپنی پراڈکٹس اور سروسز کے متعلق خصوصی پیشکشوں اور اہم معلومات فراہم کرنے کے لیے ای میلز اکٹھا کرتے ہیں۔ اپنا ای میل ایڈریس دے کر، آپ ہم سے ایسے ای میلز وصول کرنے پر اتفاق کرتے ہیں۔ اگر آپ انسبسکرائب کرنا چاہتے ہیں یا کوئی سوالات یا خدشات ہوں تو، ہماری کسٹمر سپورٹ کو لکھیں۔
Back

USD/CAD technical analysis: On the back foot below 12-week-old rising trendline

  • USD/CAD remains under pressure below key support-turned-resistance.
  • The 23.6% Fibonacci retracement, September low become likely nearby supports to watch.

Following its downside break of near-term key support line, USD/CAD declines to 1.3197during early Asian session on Monday.

The pair now aims to visit 23.6% Fibonacci retracement level of May-July south-run, at 1.3145 whereas September month low close to 1.3130 could please sellers afterward.

It should, however, be noted that the 14-bar Relative Strength Index (RSI) might drop to oversold territory during further declines and could lure counter-trend traders around 1.3130.

On the contrary, pair’s daily closing beyond support-turned-resistance, at 1.3215 now, can trigger fresh pullback to 100-day Simple Moving Average (SMA) level near 1.3240.

However, 50% Fibonacci retracement and 200-day SMA becomes a tough barrier around 1.3285/90 for buyers to confront, which if broken could escalate the recovery to monthly tops surrounding 1.3350.

USD/CAD daily chart
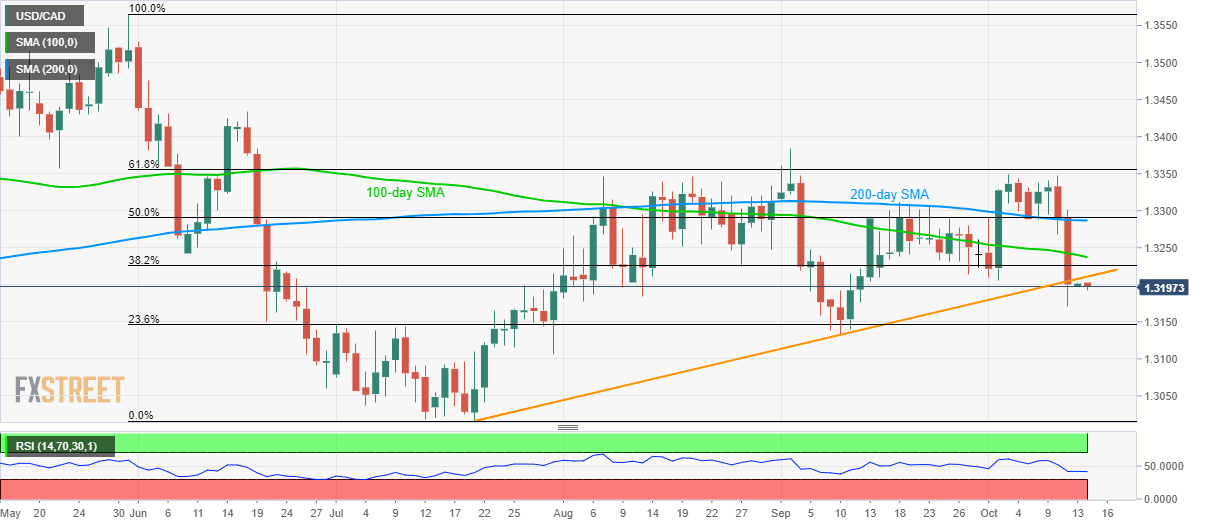
Trend: bearish


EUR/JPY technical analysis: Momentum stalling below of trendline support

Overcoming the 6-month downtrend at 118.77 and rising from 116.58/115.87 recent lows, EUR/JPY rallied to the September highs which meet the July lows,
مزید پڑھیں Previous

WTI bulls eye a run towards the 200-DMA

West Texas Intermediate crude prices are firm in the open having penetrated the 21-day moving average following a solid performance at the endo f last
مزید پڑھیں Next