Confirming you are not from the U.S. or the Philippines

یہ بیان دے کر، میں واضح طور پر یہ بتاتا اور تصدیق کرتا ہوں کہ:
  • میں امریکی شہری یا رہائشی نہیں ہوں
  • میں فلپائن کا رہائشی نہیں ہوں
  • میں بالواسطہ یا بلاواسطہ امریکی باشندوں کے 10 فیصد سے زیادہ شیئرز/ ووٹنگ کا حق/ امریکی باشندوں کے انٹرسٹ کا مالک نہیں ہوں اور/یا دوسرے ذرائع سے امریکی شہریوں یا رہائشیوں کو کنٹرول نہیں کرتا ہوں۔
  • میں بالواسطہ یا بلاواسطہ امریکی باشندوں کے 10 فیصد سے زیادہ شیئرز/ ووٹنگ کا حق/ انٹرسٹ کا مالک نہیں ہوں اور/ یا کسی دوسرے ذریعے سے امریکی شہری یا رہائشی کے کنٹرول میں نہیں ہوں۔
  • میں FATCA کے سیکشن (a)1504 کے معاملے میں امریکی شہریوں یا رہائشیوں کے ساتھ وابستہ نہیں ہوں
  • میں غلط اعلان کرنے پر اپنی ذمہ داری سے واقف ہوں۔
اس بیان کے مقاصد کے لئے، ریاستہائے متحدہ امریکہ کے تمام منحصر ممالک اور علاقوں کو امریکہ کے مرکزی علاقے کے برابر کردیا گیا ہے۔ میں اپنے اس بیان کی خلاف ورزی سے پیدا ہونے یا اس سے متعلق ہونے والے کسی بھی دعوے کے خلاف، بے ضرر آکٹا مارکیٹس انکارپوریٹڈ، اس کے ڈائریکٹرز اور افسران کا دفاع کرنے کا عہد کرتا ہوں۔
ہم آپ کی رازداری اور آپ کی ذاتی معلومات کے تحفظ کے لیے وقف ہیں۔ ہم محض اپنی پراڈکٹس اور سروسز کے متعلق خصوصی پیشکشوں اور اہم معلومات فراہم کرنے کے لیے ای میلز اکٹھا کرتے ہیں۔ اپنا ای میل ایڈریس دے کر، آپ ہم سے ایسے ای میلز وصول کرنے پر اتفاق کرتے ہیں۔ اگر آپ انسبسکرائب کرنا چاہتے ہیں یا کوئی سوالات یا خدشات ہوں تو، ہماری کسٹمر سپورٹ کو لکھیں۔
Octa trading broker
ٹریڈنگ اکاؤنٹ کھولیں
Back

EUR/JPY Technical Analysis: On the recovery mode inside multi-week-old rising channel

  • EUR/JPY holds on to recovery gains after bouncing off the three-month-old ascending trend channel’s support.
  • 50% Fibonacci retracement, a descending trend line since March on buyers’ radar.
  • 200-day SMA offers immediate support.

EUR/JPY takes the bids to 121.39 during Thursday’s Asian session. In doing so, the pair extends its recovery from a multi-week-old bullish chart pattern.

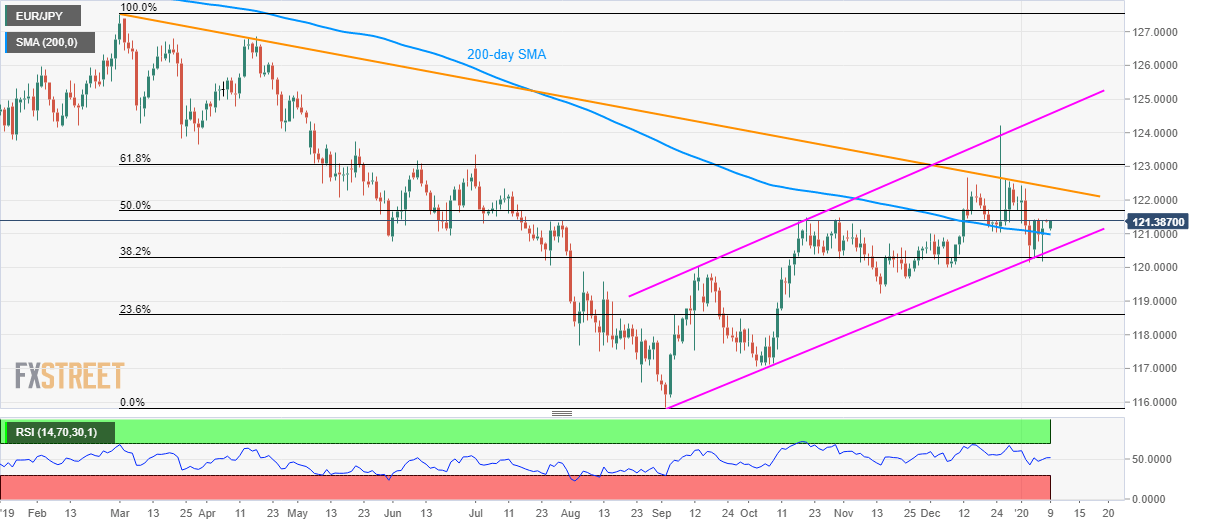
With this, buyers are gearing up for 50% Fibonacci retracement of March-September fall, at 121.70 whereas a nine-month-old descending trend line, at 122.38, could question the bulls afterward.

In a case where buyers manage to dominate past-122.38, 61.8% Fibonacci retracement and the resistance line of the aforementioned channel, near 123.07 and 124.55 respectively, will cap the pair’s further advances.

Meanwhile, a 200-day SMA level of 120.98 acts as immediate support for the pair ahead of the channel’s lower-line, around 120.49 now.

If at all sellers defy the bullish chart formation, 120.00 and mid-November low near 119.24 will be on their watch-list.

EUR/JPY daily chart

Trend: Bullish


NZD/USD technical analysis: 5-day MA is capping upside

NZD/USD is sidelined near 0.6648 at press time, having faced rejection at the descending 5-day moving average hurdle at 0.6658 a few minutes ago. Bear
مزید پڑھیں Previous

Odds of RBA rate cut on the rise as Aussie bushfires regenerate

Reuters reporting on the Australian bushfire crisis with authorities issuing new warnings and evacuation notices across southeast Australia on Thursda
مزید پڑھیں Next