Confirming you are not from the U.S. or the Philippines

یہ بیان دے کر، میں واضح طور پر یہ بتاتا اور تصدیق کرتا ہوں کہ:
  • میں امریکی شہری یا رہائشی نہیں ہوں
  • میں فلپائن کا رہائشی نہیں ہوں
  • میں بالواسطہ یا بلاواسطہ امریکی باشندوں کے 10 فیصد سے زیادہ شیئرز/ ووٹنگ کا حق/ امریکی باشندوں کے انٹرسٹ کا مالک نہیں ہوں اور/یا دوسرے ذرائع سے امریکی شہریوں یا رہائشیوں کو کنٹرول نہیں کرتا ہوں۔
  • میں بالواسطہ یا بلاواسطہ امریکی باشندوں کے 10 فیصد سے زیادہ شیئرز/ ووٹنگ کا حق/ انٹرسٹ کا مالک نہیں ہوں اور/ یا کسی دوسرے ذریعے سے امریکی شہری یا رہائشی کے کنٹرول میں نہیں ہوں۔
  • میں FATCA کے سیکشن (a)1504 کے معاملے میں امریکی شہریوں یا رہائشیوں کے ساتھ وابستہ نہیں ہوں
  • میں غلط اعلان کرنے پر اپنی ذمہ داری سے واقف ہوں۔
اس بیان کے مقاصد کے لئے، ریاستہائے متحدہ امریکہ کے تمام منحصر ممالک اور علاقوں کو امریکہ کے مرکزی علاقے کے برابر کردیا گیا ہے۔ میں اپنے اس بیان کی خلاف ورزی سے پیدا ہونے یا اس سے متعلق ہونے والے کسی بھی دعوے کے خلاف، بے ضرر آکٹا مارکیٹس انکارپوریٹڈ، اس کے ڈائریکٹرز اور افسران کا دفاع کرنے کا عہد کرتا ہوں۔
ہم آپ کی رازداری اور آپ کی ذاتی معلومات کے تحفظ کے لیے وقف ہیں۔ ہم محض اپنی پراڈکٹس اور سروسز کے متعلق خصوصی پیشکشوں اور اہم معلومات فراہم کرنے کے لیے ای میلز اکٹھا کرتے ہیں۔ اپنا ای میل ایڈریس دے کر، آپ ہم سے ایسے ای میلز وصول کرنے پر اتفاق کرتے ہیں۔ اگر آپ انسبسکرائب کرنا چاہتے ہیں یا کوئی سوالات یا خدشات ہوں تو، ہماری کسٹمر سپورٹ کو لکھیں۔
Octa trading broker
ٹریڈنگ اکاؤنٹ کھولیں
Back

USD/INR Technical Analysis: 100-day EMA checks sellers near three-week low

  • USD/INR extends losses to the third day in a row.
  • 23.6% Fibonacci retracement, 200-day EMA act as additional supports.
  • Buyers will look for entry beyond 61.8% Fibonacci retracement.

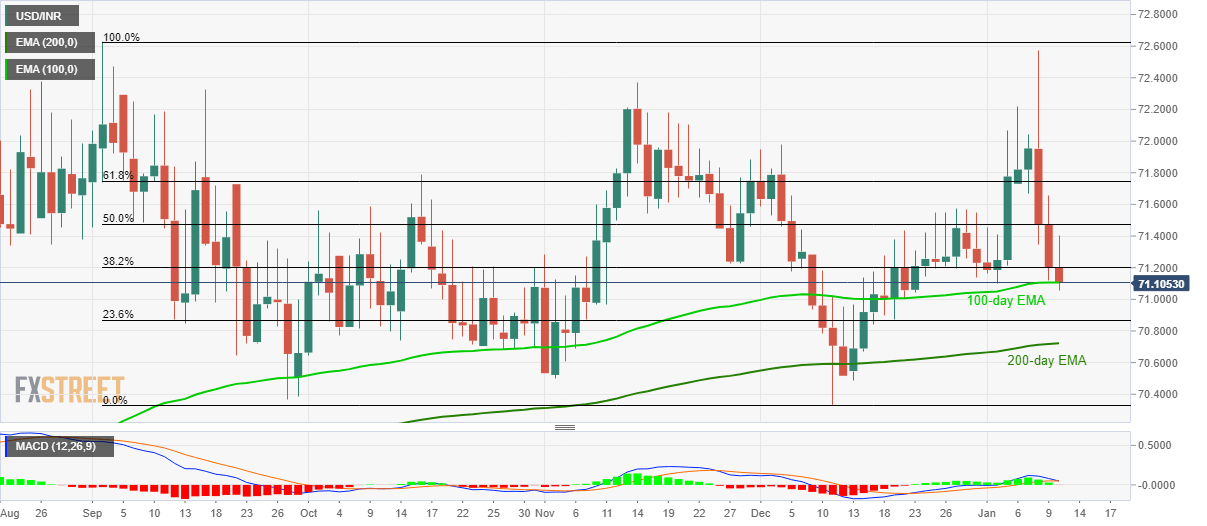
USD/INR declines to 71.12, after printing the low of 71.05, ahead of the European open on Friday. The pair tests 100-day EMA amid bullish MACD, which in turn signal brighter chances of the pair’s recovery.

In doing so, 50% Fibonacci retracement level of September-December fall, at 71.48 will be the immediate choice of buyers during the recovery. However, the pair’s further gains will be restricted by 61.8% Fibonacci retracement around 71.75.

In a case where USD/INR manages to stay positive beyond 71.75, the Bulls can take the reins to cross 72.00 while targeting September 2019 high of 72.63.

Alternatively, pair’s daily closing below 100-day EMA level of 71.10 can push prices further down to 23.6% Fibonacci retracement and 200-day EMA, near 70.86 and 70.72 respectively.

If the bears keep dominating past-70.72, December month bottom near 70.32 and 70.00 round-figure will return to the chart.

USD/INR daily chart
Trend: Pullback expected


GBP/USD consolidates losses amid pre-NFP lull

GBP/USD recovers the latest losses while taking the bids to 1.3080 ahead of the London open on Friday. The pair dropped the previous day after the BOE
مزید پڑھیں Previous

US Dollar Index looks flat around 97.40, Payrolls in sight

The greenback is trading within a sideline theme in the 97.40 region so far at the end of the week when gauged by the US Dollar Index (DXY). US Dollar
مزید پڑھیں Next