Confirming you are not from the U.S. or the Philippines

یہ بیان دے کر، میں واضح طور پر یہ بتاتا اور تصدیق کرتا ہوں کہ:
  • میں امریکی شہری یا رہائشی نہیں ہوں
  • میں فلپائن کا رہائشی نہیں ہوں
  • میں بالواسطہ یا بلاواسطہ امریکی باشندوں کے 10 فیصد سے زیادہ شیئرز/ ووٹنگ کا حق/ امریکی باشندوں کے انٹرسٹ کا مالک نہیں ہوں اور/یا دوسرے ذرائع سے امریکی شہریوں یا رہائشیوں کو کنٹرول نہیں کرتا ہوں۔
  • میں بالواسطہ یا بلاواسطہ امریکی باشندوں کے 10 فیصد سے زیادہ شیئرز/ ووٹنگ کا حق/ انٹرسٹ کا مالک نہیں ہوں اور/ یا کسی دوسرے ذریعے سے امریکی شہری یا رہائشی کے کنٹرول میں نہیں ہوں۔
  • میں FATCA کے سیکشن (a)1504 کے معاملے میں امریکی شہریوں یا رہائشیوں کے ساتھ وابستہ نہیں ہوں
  • میں غلط اعلان کرنے پر اپنی ذمہ داری سے واقف ہوں۔
اس بیان کے مقاصد کے لئے، ریاستہائے متحدہ امریکہ کے تمام منحصر ممالک اور علاقوں کو امریکہ کے مرکزی علاقے کے برابر کردیا گیا ہے۔ میں اپنے اس بیان کی خلاف ورزی سے پیدا ہونے یا اس سے متعلق ہونے والے کسی بھی دعوے کے خلاف، بے ضرر آکٹا مارکیٹس انکارپوریٹڈ، اس کے ڈائریکٹرز اور افسران کا دفاع کرنے کا عہد کرتا ہوں۔
ہم آپ کی رازداری اور آپ کی ذاتی معلومات کے تحفظ کے لیے وقف ہیں۔ ہم محض اپنی پراڈکٹس اور سروسز کے متعلق خصوصی پیشکشوں اور اہم معلومات فراہم کرنے کے لیے ای میلز اکٹھا کرتے ہیں۔ اپنا ای میل ایڈریس دے کر، آپ ہم سے ایسے ای میلز وصول کرنے پر اتفاق کرتے ہیں۔ اگر آپ انسبسکرائب کرنا چاہتے ہیں یا کوئی سوالات یا خدشات ہوں تو، ہماری کسٹمر سپورٹ کو لکھیں۔
Octa trading broker
ٹریڈنگ اکاؤنٹ کھولیں
Back

USD/JPY Price Analysis: Refreshes two-week high above 61.8% Fibonacci

  • USD/JPY holds onto recovery gains from 200-day SMA.
  • A descending trend line from May, an upward sloping resistance line since November in focus.
  • Sustained break of the key Fibonacci level, bullish MACD favor further upside.

USD/JPY extends the four-day-old winning streak to 109.90 during early Thursday. The pair stays on the front foot after clearing 61.8% Fibonacci retracement of its April-August 2019 fall whereas bullish MACD signal portrays the strength of upside momentum.

While 110.00 round-figure could offer immediate resistance to the pair, a falling trend line since May 21, 2019, near 110.25, gains the major attention of buyers.

Additionally, the pair’s upward trajectory beyond 110.25 could aim for a rising trend line that connects the tops marked in the last three months, at 110.55.

On the flip side, sellers will refrain from entry unless prices slip below 109.53, comprising 61.8% Fibonacci retracement, on a daily closing basis.

Even so, 50% Fibonacci retracement and 200-day SMA, around 108.65 and 108.38, can keep further declines questionable.
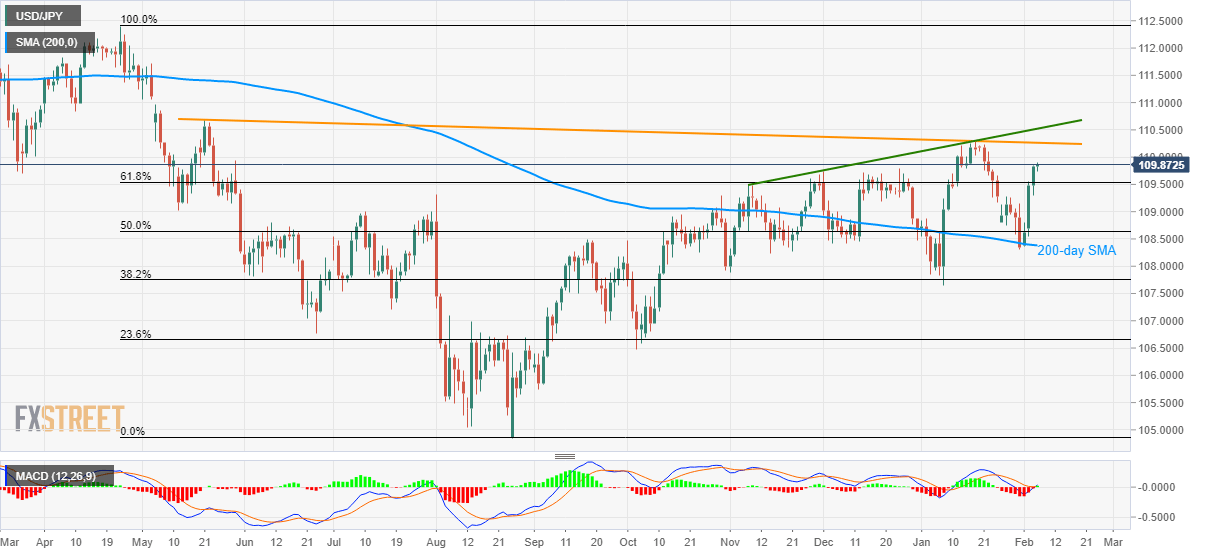
USD/JPY daily chart

Trend: Bullish


Indonesian Consumer Confidence drops sharply to 121.7 in Jan, Rupiah stalls the upside

The latest survey conducted by Bank Indonesia (BI), the Indonesian central bank, showed that the country’s Consumer Confidence Index worsened to 121.7
مزید پڑھیں Previous

WTI rises above $52 as bulls ignore uptick in US oil inventories

WTI oil is extending overnight gains despite the uptick in the US oil inventories. At press time, the black gold is trading near $51.80, representing
مزید پڑھیں Next