Confirming you are not from the U.S. or the Philippines

یہ بیان دے کر، میں واضح طور پر یہ بتاتا اور تصدیق کرتا ہوں کہ:
  • میں امریکی شہری یا رہائشی نہیں ہوں
  • میں فلپائن کا رہائشی نہیں ہوں
  • میں بالواسطہ یا بلاواسطہ امریکی باشندوں کے 10 فیصد سے زیادہ شیئرز/ ووٹنگ کا حق/ امریکی باشندوں کے انٹرسٹ کا مالک نہیں ہوں اور/یا دوسرے ذرائع سے امریکی شہریوں یا رہائشیوں کو کنٹرول نہیں کرتا ہوں۔
  • میں بالواسطہ یا بلاواسطہ امریکی باشندوں کے 10 فیصد سے زیادہ شیئرز/ ووٹنگ کا حق/ انٹرسٹ کا مالک نہیں ہوں اور/ یا کسی دوسرے ذریعے سے امریکی شہری یا رہائشی کے کنٹرول میں نہیں ہوں۔
  • میں FATCA کے سیکشن (a)1504 کے معاملے میں امریکی شہریوں یا رہائشیوں کے ساتھ وابستہ نہیں ہوں
  • میں غلط اعلان کرنے پر اپنی ذمہ داری سے واقف ہوں۔
اس بیان کے مقاصد کے لئے، ریاستہائے متحدہ امریکہ کے تمام منحصر ممالک اور علاقوں کو امریکہ کے مرکزی علاقے کے برابر کردیا گیا ہے۔ میں اپنے اس بیان کی خلاف ورزی سے پیدا ہونے یا اس سے متعلق ہونے والے کسی بھی دعوے کے خلاف، بے ضرر آکٹا مارکیٹس انکارپوریٹڈ، اس کے ڈائریکٹرز اور افسران کا دفاع کرنے کا عہد کرتا ہوں۔
ہم آپ کی رازداری اور آپ کی ذاتی معلومات کے تحفظ کے لیے وقف ہیں۔ ہم محض اپنی پراڈکٹس اور سروسز کے متعلق خصوصی پیشکشوں اور اہم معلومات فراہم کرنے کے لیے ای میلز اکٹھا کرتے ہیں۔ اپنا ای میل ایڈریس دے کر، آپ ہم سے ایسے ای میلز وصول کرنے پر اتفاق کرتے ہیں۔ اگر آپ انسبسکرائب کرنا چاہتے ہیں یا کوئی سوالات یا خدشات ہوں تو، ہماری کسٹمر سپورٹ کو لکھیں۔
Octa trading broker
ٹریڈنگ اکاؤنٹ کھولیں
Back

USD/CHF Price Analysis: Greenback grinding up vs. Swiss franc, clings to 2020 highs

  • USD/CHF is slowly advancing printing fresh 2020 highs by a few pips.
  • The rising wedge formations can limit the upside on USD/CHF. 
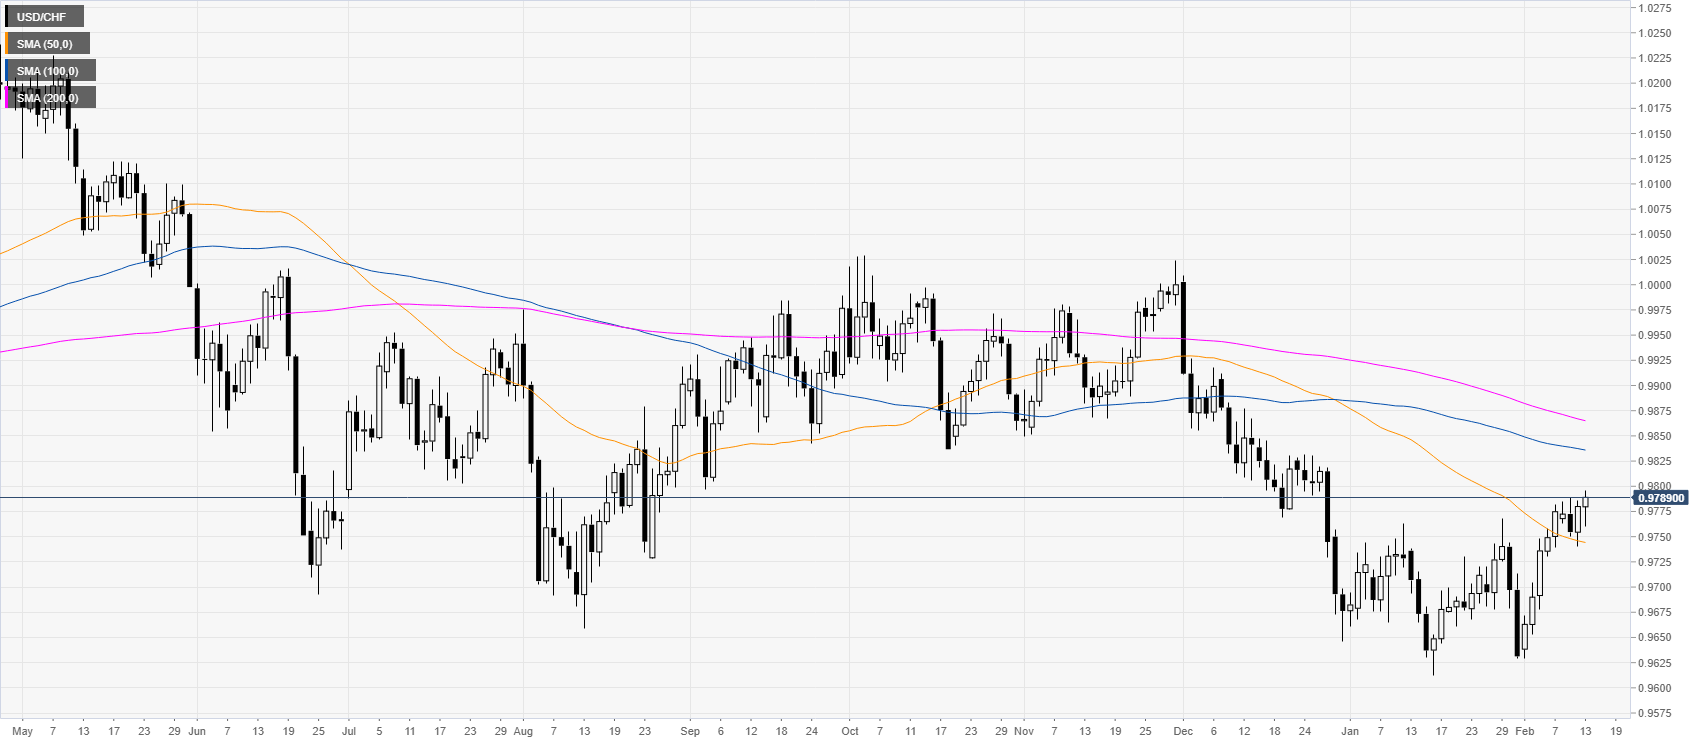
 

USD/CHF daily chart

 
USD/CHF is printing new 2020 highs while the quote is trading below the 100/200-day simple moving averages suggesting an overall bearish momentum.
 

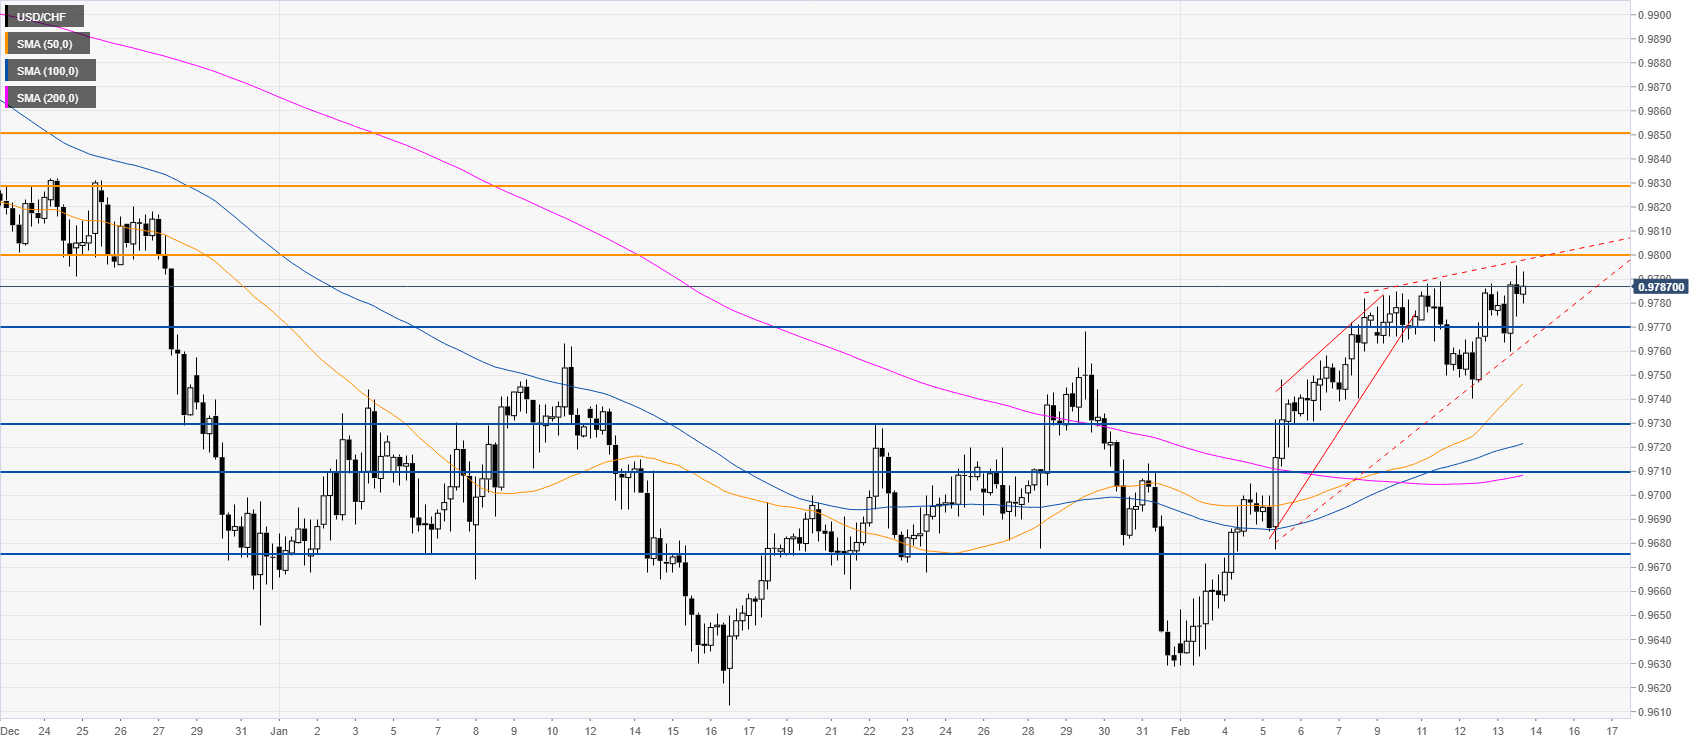
USD/CHF four-hour chart

 
After USD/CHF broke below the rising wedge pattern the market made a retest of the high creating a higher high by a few pips just below the 0.9800 figure. The spot is also trading within a larger rising wedge pattern which can be seen as potentially bearish if the bears start to show some signs of conviction. In fact, bears want to weaken the market and trade below the 0.9770 level to drive the quote below the last swing low towards the 0.9730 and 0.9710 price levels. However, a daily break above the 0.9800 figure might invalidate the bearish scenario and lead to an acceleration towards the 0.9830 and 0.9850 price levels. 
 
 
Resistance: 0.9800, 0.9830, 0.9850
Support: 0.9770, 0.9730, 0.9710
 

Additional key levels


United States 30-Year Bond Auction fell from previous 2.341% to 2.061%

United States 30-Year Bond Auction fell from previous 2.341% to 2.061%
مزید پڑھیں Previous

AUD/USD mirrors commodity and EM complex of which are testing critical technical resistance

AUD/USD is currently trading at 0.6727 and between 0.6707 and 0.6745 and has been capped in its tracks from the correction from 2020 trend lows of 0.6
مزید پڑھیں Next