Confirming you are not from the U.S. or the Philippines

یہ بیان دے کر، میں واضح طور پر یہ بتاتا اور تصدیق کرتا ہوں کہ:
  • میں امریکی شہری یا رہائشی نہیں ہوں
  • میں فلپائن کا رہائشی نہیں ہوں
  • میں بالواسطہ یا بلاواسطہ امریکی باشندوں کے 10 فیصد سے زیادہ شیئرز/ ووٹنگ کا حق/ امریکی باشندوں کے انٹرسٹ کا مالک نہیں ہوں اور/یا دوسرے ذرائع سے امریکی شہریوں یا رہائشیوں کو کنٹرول نہیں کرتا ہوں۔
  • میں بالواسطہ یا بلاواسطہ امریکی باشندوں کے 10 فیصد سے زیادہ شیئرز/ ووٹنگ کا حق/ انٹرسٹ کا مالک نہیں ہوں اور/ یا کسی دوسرے ذریعے سے امریکی شہری یا رہائشی کے کنٹرول میں نہیں ہوں۔
  • میں FATCA کے سیکشن (a)1504 کے معاملے میں امریکی شہریوں یا رہائشیوں کے ساتھ وابستہ نہیں ہوں
  • میں غلط اعلان کرنے پر اپنی ذمہ داری سے واقف ہوں۔
اس بیان کے مقاصد کے لئے، ریاستہائے متحدہ امریکہ کے تمام منحصر ممالک اور علاقوں کو امریکہ کے مرکزی علاقے کے برابر کردیا گیا ہے۔ میں اپنے اس بیان کی خلاف ورزی سے پیدا ہونے یا اس سے متعلق ہونے والے کسی بھی دعوے کے خلاف، بے ضرر آکٹا مارکیٹس انکارپوریٹڈ، اس کے ڈائریکٹرز اور افسران کا دفاع کرنے کا عہد کرتا ہوں۔
ہم آپ کی رازداری اور آپ کی ذاتی معلومات کے تحفظ کے لیے وقف ہیں۔ ہم محض اپنی پراڈکٹس اور سروسز کے متعلق خصوصی پیشکشوں اور اہم معلومات فراہم کرنے کے لیے ای میلز اکٹھا کرتے ہیں۔ اپنا ای میل ایڈریس دے کر، آپ ہم سے ایسے ای میلز وصول کرنے پر اتفاق کرتے ہیں۔ اگر آپ انسبسکرائب کرنا چاہتے ہیں یا کوئی سوالات یا خدشات ہوں تو، ہماری کسٹمر سپورٹ کو لکھیں۔
Octa trading broker
ٹریڈنگ اکاؤنٹ کھولیں
Back

AUD/JPY Price Analysis: Bearish spinning top portrays sellers’ exhaustion

  • AUD/JPY remains under pressure for the first consecutive day.
  • The candlestick on the daily chart suggests sellers’ exhaustion, a pullback move.
  • 5-day SMA, monthly resistance line restrict immediate recovery.

While extending its declines for the third day in a row, AUD/JPY drops to 64.35 amid the early Asian session on Wednesday. Even so, the pair portrays sellers’ exhaustion on the daily chart suggesting bounces off the short-term support line.

In a case where the bearish MACD drags the quote below the seven-day-old falling trend line, at 63.85, the sellers could take further steps to inch closer towards 63.00 whereas early- February 2009 tops near 62.60 might entertain the sellers afterward.

On the upside, 5-day SMA offers the immediate resistance around 65.10 while the monthly falling trend line, currently near 66.25, can question the bulls then after.

In a case where the buyers manage to cross 66.25 on a daily closing basis, they confirm the short-term bullish technical formation, namely falling wedge, which in turn could trigger the fresh run-up towards the monthly top near 71.40/45.

AUD/JPY daily chart
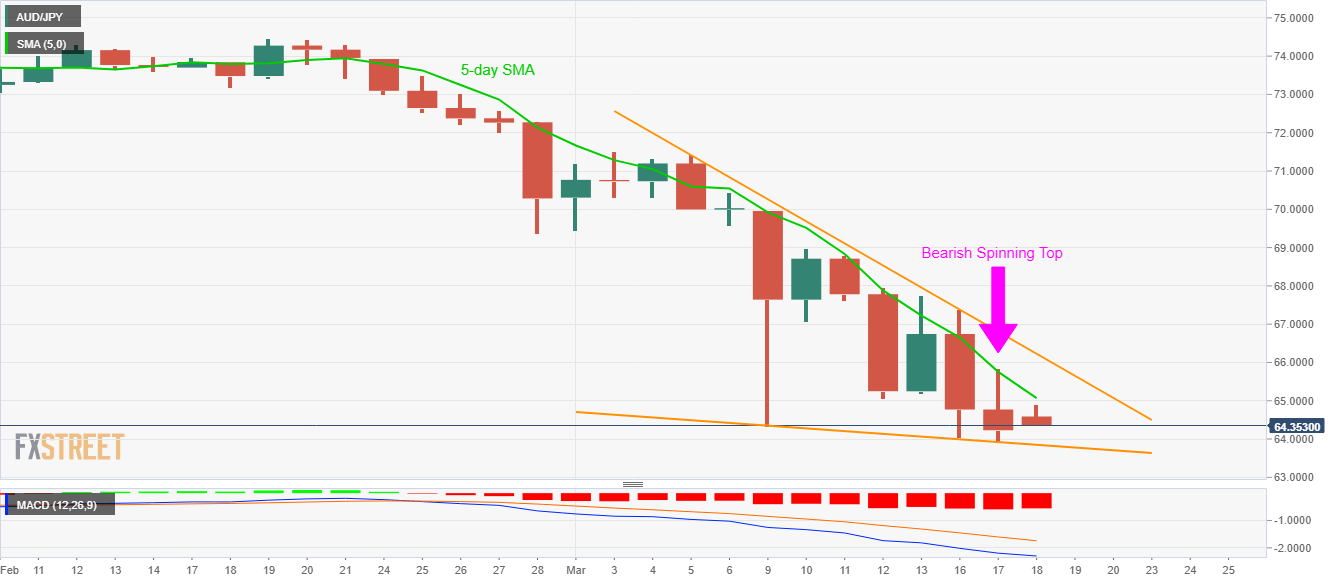
Trend: Pullback expected


US Treasury Secretary Mnuchin: Coronavirus outbreak could push unemployment up to 20% without action

US Treasury Secretary Mnuchin stated that the Coronavirus outbreak could push unemployment up to 20% without action. Mnuchin also said the Trump admin
مزید پڑھیں Previous

WTI stabilizing just ahead of the 2016 lows

West Texas Intermediate crude came in a stone throw of the 2016 lows on Tuesday in the US session but bounced late in the day and is currently trading
مزید پڑھیں Next