Confirming you are not from the U.S. or the Philippines

یہ بیان دے کر، میں واضح طور پر یہ بتاتا اور تصدیق کرتا ہوں کہ:
  • میں امریکی شہری یا رہائشی نہیں ہوں
  • میں فلپائن کا رہائشی نہیں ہوں
  • میں بالواسطہ یا بلاواسطہ امریکی باشندوں کے 10 فیصد سے زیادہ شیئرز/ ووٹنگ کا حق/ امریکی باشندوں کے انٹرسٹ کا مالک نہیں ہوں اور/یا دوسرے ذرائع سے امریکی شہریوں یا رہائشیوں کو کنٹرول نہیں کرتا ہوں۔
  • میں بالواسطہ یا بلاواسطہ امریکی باشندوں کے 10 فیصد سے زیادہ شیئرز/ ووٹنگ کا حق/ انٹرسٹ کا مالک نہیں ہوں اور/ یا کسی دوسرے ذریعے سے امریکی شہری یا رہائشی کے کنٹرول میں نہیں ہوں۔
  • میں FATCA کے سیکشن (a)1504 کے معاملے میں امریکی شہریوں یا رہائشیوں کے ساتھ وابستہ نہیں ہوں
  • میں غلط اعلان کرنے پر اپنی ذمہ داری سے واقف ہوں۔
اس بیان کے مقاصد کے لئے، ریاستہائے متحدہ امریکہ کے تمام منحصر ممالک اور علاقوں کو امریکہ کے مرکزی علاقے کے برابر کردیا گیا ہے۔ میں اپنے اس بیان کی خلاف ورزی سے پیدا ہونے یا اس سے متعلق ہونے والے کسی بھی دعوے کے خلاف، بے ضرر آکٹا مارکیٹس انکارپوریٹڈ، اس کے ڈائریکٹرز اور افسران کا دفاع کرنے کا عہد کرتا ہوں۔
ہم آپ کی رازداری اور آپ کی ذاتی معلومات کے تحفظ کے لیے وقف ہیں۔ ہم محض اپنی پراڈکٹس اور سروسز کے متعلق خصوصی پیشکشوں اور اہم معلومات فراہم کرنے کے لیے ای میلز اکٹھا کرتے ہیں۔ اپنا ای میل ایڈریس دے کر، آپ ہم سے ایسے ای میلز وصول کرنے پر اتفاق کرتے ہیں۔ اگر آپ انسبسکرائب کرنا چاہتے ہیں یا کوئی سوالات یا خدشات ہوں تو، ہماری کسٹمر سپورٹ کو لکھیں۔
Octa trading broker
ٹریڈنگ اکاؤنٹ کھولیں
Back

USD/CAD Price Analysis: 200-day SMA probes inverted hammer on daily chart

  • USD/CAD extends recovery moves from 1.3386, but stays below 200-day SMA.
  • Bullish candlestick formation, coupled with oversold RSI, keeps buyers hopeful.
  • March month low may entertain sellers during the fresh downside below recent lows.

USD/CAD keeps the previous day’s pullback from three-month low while taking the bids near 1.3420 amid the initial Asian session on Wednesday. The Loonie pair printed an inverted hammer candle on the daily chart on Tuesday. The trend reversal suggesting candlestick formation joins oversold RSI conditions to suggest the pair’s further recovery.

As a result, the 200-day SMA level of 1.3465 becomes the immediate upside target for the buyers to watch. However, the pair’s further advances depend upon how well it crosses March 09 low of 1.3517.

Should the quote manage to provide a daily closing beyond 1.3517, late-May bottom around 1.3730 might lure the buyers.

Alternatively, the pair’s downside below the weekly low of 1.3357 will negate the hopes for the bulls. In doing so, the USD/CAD prices may drop to March month low 1.3315.

In a case where the bears dominate past-1.3315, February month bottom surrounding 1.3200 could return to the charts.

USD/CAD daily chart
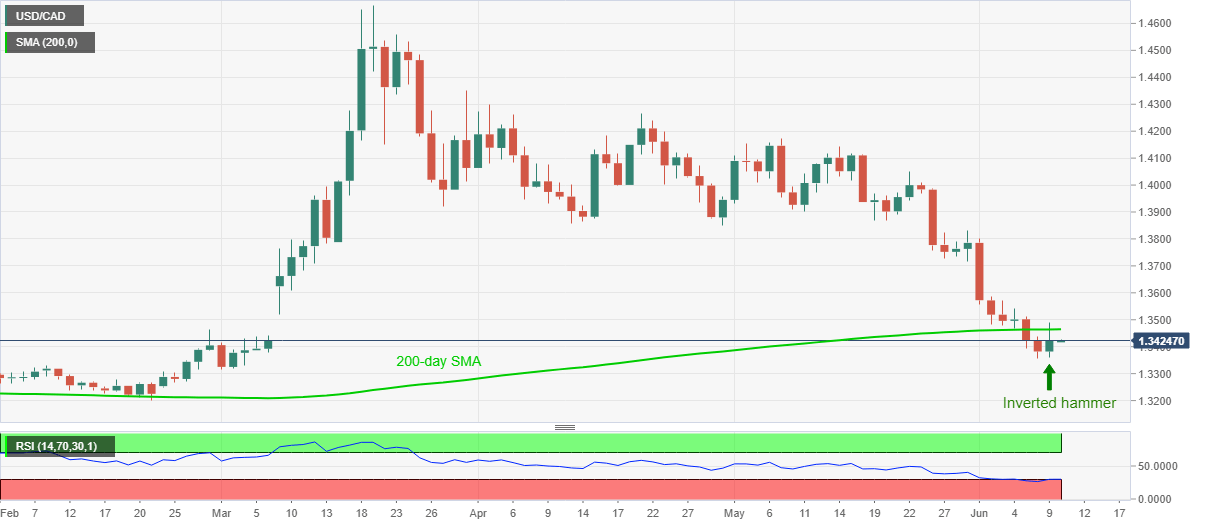
Trend: Further recovery expected


Japan Machinery Orders (YoY) came in at -17.7%, below expectations (-14%) in April

Japan Machinery Orders (YoY) came in at -17.7%, below expectations (-14%) in April
مزید پڑھیں Previous

Gold holding in positive territory ahead of the Fed showdown

Gold prices have been elevated, taking back territory in the 1700s while risk appetite has cooled in the US and Europe. Analysts say the market has be
مزید پڑھیں Next