Confirming you are not from the U.S. or the Philippines

یہ بیان دے کر، میں واضح طور پر یہ بتاتا اور تصدیق کرتا ہوں کہ:
  • میں امریکی شہری یا رہائشی نہیں ہوں
  • میں فلپائن کا رہائشی نہیں ہوں
  • میں بالواسطہ یا بلاواسطہ امریکی باشندوں کے 10 فیصد سے زیادہ شیئرز/ ووٹنگ کا حق/ امریکی باشندوں کے انٹرسٹ کا مالک نہیں ہوں اور/یا دوسرے ذرائع سے امریکی شہریوں یا رہائشیوں کو کنٹرول نہیں کرتا ہوں۔
  • میں بالواسطہ یا بلاواسطہ امریکی باشندوں کے 10 فیصد سے زیادہ شیئرز/ ووٹنگ کا حق/ انٹرسٹ کا مالک نہیں ہوں اور/ یا کسی دوسرے ذریعے سے امریکی شہری یا رہائشی کے کنٹرول میں نہیں ہوں۔
  • میں FATCA کے سیکشن (a)1504 کے معاملے میں امریکی شہریوں یا رہائشیوں کے ساتھ وابستہ نہیں ہوں
  • میں غلط اعلان کرنے پر اپنی ذمہ داری سے واقف ہوں۔
اس بیان کے مقاصد کے لئے، ریاستہائے متحدہ امریکہ کے تمام منحصر ممالک اور علاقوں کو امریکہ کے مرکزی علاقے کے برابر کردیا گیا ہے۔ میں اپنے اس بیان کی خلاف ورزی سے پیدا ہونے یا اس سے متعلق ہونے والے کسی بھی دعوے کے خلاف، بے ضرر آکٹا مارکیٹس انکارپوریٹڈ، اس کے ڈائریکٹرز اور افسران کا دفاع کرنے کا عہد کرتا ہوں۔
ہم آپ کی رازداری اور آپ کی ذاتی معلومات کے تحفظ کے لیے وقف ہیں۔ ہم محض اپنی پراڈکٹس اور سروسز کے متعلق خصوصی پیشکشوں اور اہم معلومات فراہم کرنے کے لیے ای میلز اکٹھا کرتے ہیں۔ اپنا ای میل ایڈریس دے کر، آپ ہم سے ایسے ای میلز وصول کرنے پر اتفاق کرتے ہیں۔ اگر آپ انسبسکرائب کرنا چاہتے ہیں یا کوئی سوالات یا خدشات ہوں تو، ہماری کسٹمر سپورٹ کو لکھیں۔
Octa trading broker
ٹریڈنگ اکاؤنٹ کھولیں
Back

AUD/USD Price Analysis: Bears monitoring for failures at resistance

  • AUD/USD bears need a break of support to confirm a downside bias. 
  • Bulls are in charge while testing deeper into the weekly resistance. 

AUD/USD bulls in charge on the longterm time frames, but a close below resistance will open prospects of a retracement of the daily bullish impulse. 

The following is a topdown analysis that illustrates where the next opportunity could arise on the lower time frames.

Weekly chart, AUD/USD

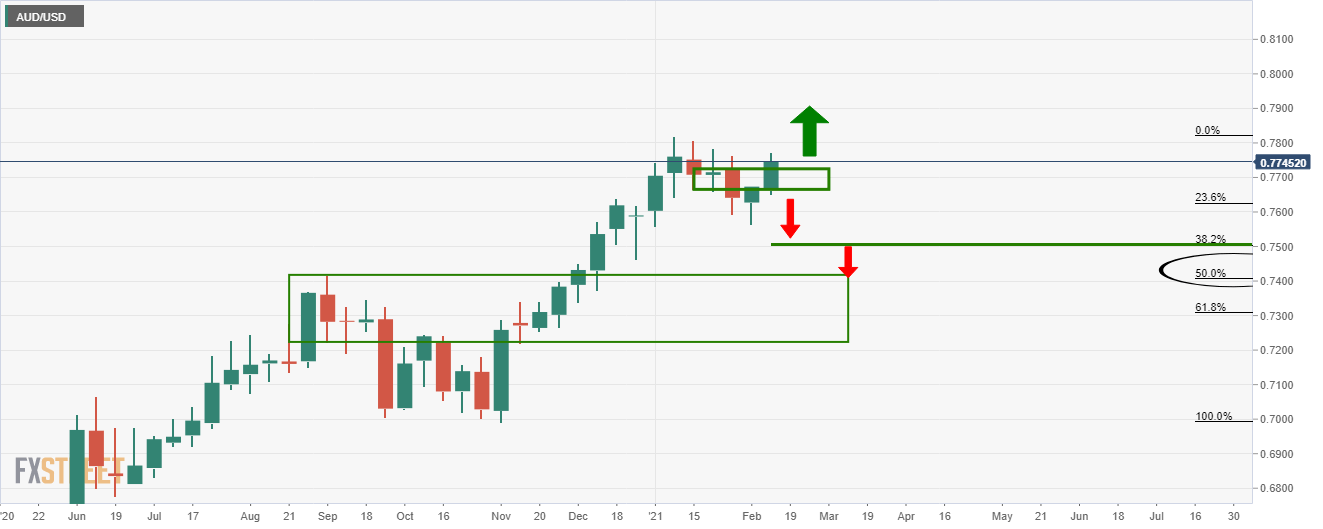
There is an upside bias so long as the price remains above this newly formed support following the recent bullish weekly test of resistance. 

A weekly close above the prior highs will negate downward trade setups. 

Daily chart, AUD/USD

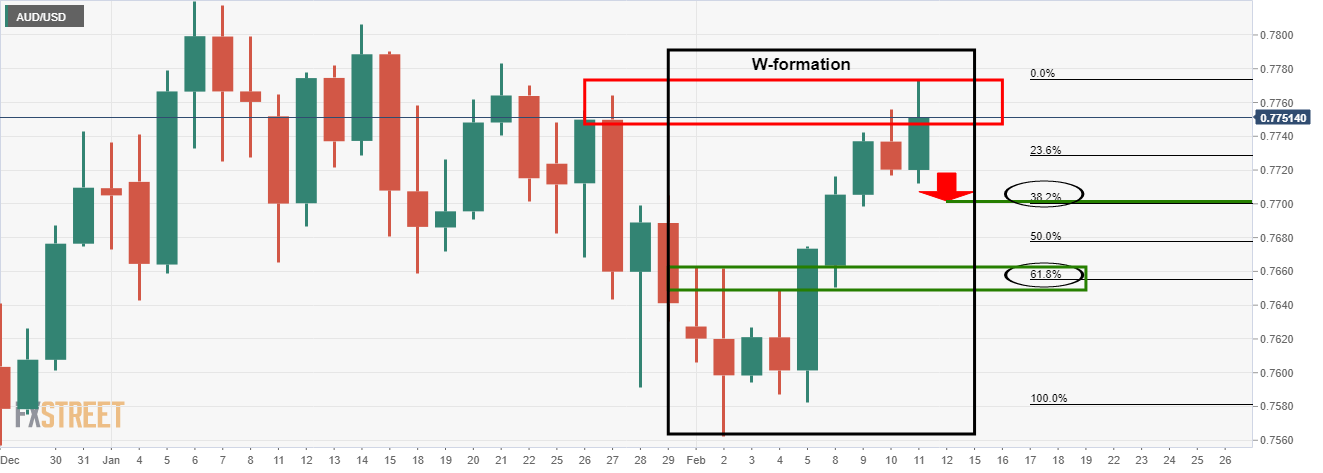
With that being said, the daily chart is offering a different scenario. 

The W-formation is a bearish chart pattern that would expect to see at least a 38.2% Fibonacci retracement of the bullish impulse.

A test of the 0.77 figure is, therefore, to play for still. However, a daily close above the prior day's highs will be bullish. 

4-hour chart, AUD/USD

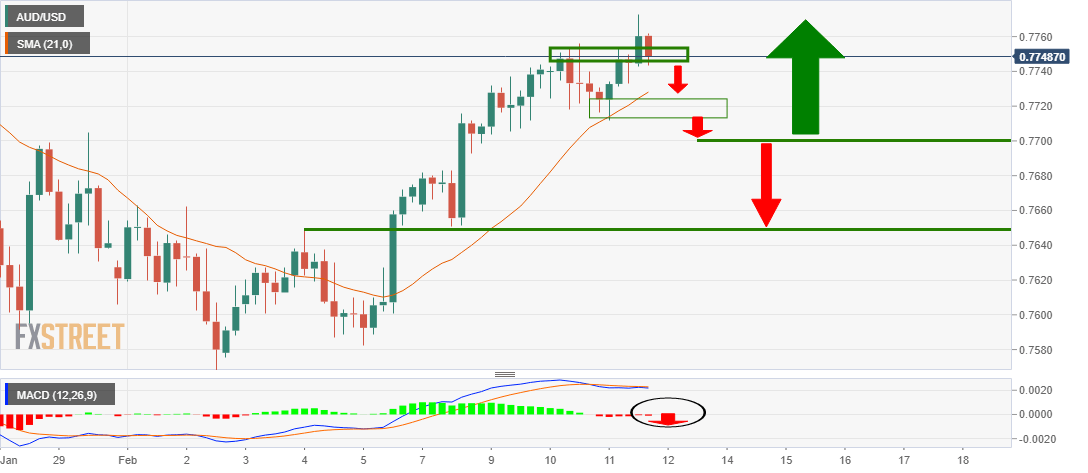
The conditions on the 4-hour chart are bullish.

There is little in the way of a high probability setup that can be taken by the bears in targeting 0.77 the figure until the bearish structure has been forme, or MACD is below the zero line and price below the 21 moving average. 

Given the proximity of the 0.77 figure and price, there is little in the way of reward and a lower time frame would be more appropriate in this scenario. 

1-hour chart

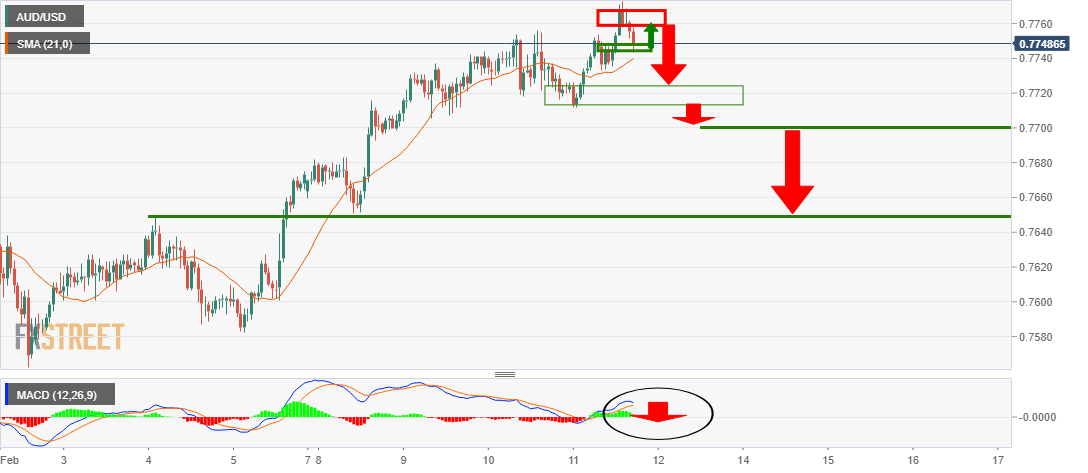
The 1-hour chart offers prospects of a trade set up if the price breaks support and retests the structure from resistance.

A break below the lows will open risk towards the neckline of the daily M-formation and confluence of a 61.8% Fibonacci retracement of the daily impulse around 0.7650. 

United States 30-Year Bond Auction up to 1.933% from previous 1.825%

United States 30-Year Bond Auction up to 1.933% from previous 1.825%
مزید پڑھیں Previous

Data from UK and Israel show COVID-19 vaccines are working – Danske Bank

Assessing the latest developments surrounding the coronavirus, Danske Bank analysts noted that new data from Israel and the UK show that the vaccines
مزید پڑھیں Next