Confirming you are not from the U.S. or the Philippines

یہ بیان دے کر، میں واضح طور پر یہ بتاتا اور تصدیق کرتا ہوں کہ:
  • میں امریکی شہری یا رہائشی نہیں ہوں
  • میں فلپائن کا رہائشی نہیں ہوں
  • میں بالواسطہ یا بلاواسطہ امریکی باشندوں کے 10 فیصد سے زیادہ شیئرز/ ووٹنگ کا حق/ امریکی باشندوں کے انٹرسٹ کا مالک نہیں ہوں اور/یا دوسرے ذرائع سے امریکی شہریوں یا رہائشیوں کو کنٹرول نہیں کرتا ہوں۔
  • میں بالواسطہ یا بلاواسطہ امریکی باشندوں کے 10 فیصد سے زیادہ شیئرز/ ووٹنگ کا حق/ انٹرسٹ کا مالک نہیں ہوں اور/ یا کسی دوسرے ذریعے سے امریکی شہری یا رہائشی کے کنٹرول میں نہیں ہوں۔
  • میں FATCA کے سیکشن (a)1504 کے معاملے میں امریکی شہریوں یا رہائشیوں کے ساتھ وابستہ نہیں ہوں
  • میں غلط اعلان کرنے پر اپنی ذمہ داری سے واقف ہوں۔
اس بیان کے مقاصد کے لئے، ریاستہائے متحدہ امریکہ کے تمام منحصر ممالک اور علاقوں کو امریکہ کے مرکزی علاقے کے برابر کردیا گیا ہے۔ میں اپنے اس بیان کی خلاف ورزی سے پیدا ہونے یا اس سے متعلق ہونے والے کسی بھی دعوے کے خلاف، بے ضرر آکٹا مارکیٹس انکارپوریٹڈ، اس کے ڈائریکٹرز اور افسران کا دفاع کرنے کا عہد کرتا ہوں۔
ہم آپ کی رازداری اور آپ کی ذاتی معلومات کے تحفظ کے لیے وقف ہیں۔ ہم محض اپنی پراڈکٹس اور سروسز کے متعلق خصوصی پیشکشوں اور اہم معلومات فراہم کرنے کے لیے ای میلز اکٹھا کرتے ہیں۔ اپنا ای میل ایڈریس دے کر، آپ ہم سے ایسے ای میلز وصول کرنے پر اتفاق کرتے ہیں۔ اگر آپ انسبسکرائب کرنا چاہتے ہیں یا کوئی سوالات یا خدشات ہوں تو، ہماری کسٹمر سپورٹ کو لکھیں۔
Octa trading broker
ٹریڈنگ اکاؤنٹ کھولیں
Back

EUR/USD Price Analysis: Bears are lurking with eyes on 61.8% Fibo target

  • EUR/USD struggles to convince on the upside and bears are lurking.
  • A downside test of the 61.8% Fibo of the daily impulse could be on the cards. 

EUR/USD is on the verge of a significant correction according to the following top-down analysis that illustrates the market structure and bearish bias across the monthly, weekly and daily time frames. 

Monthly chart

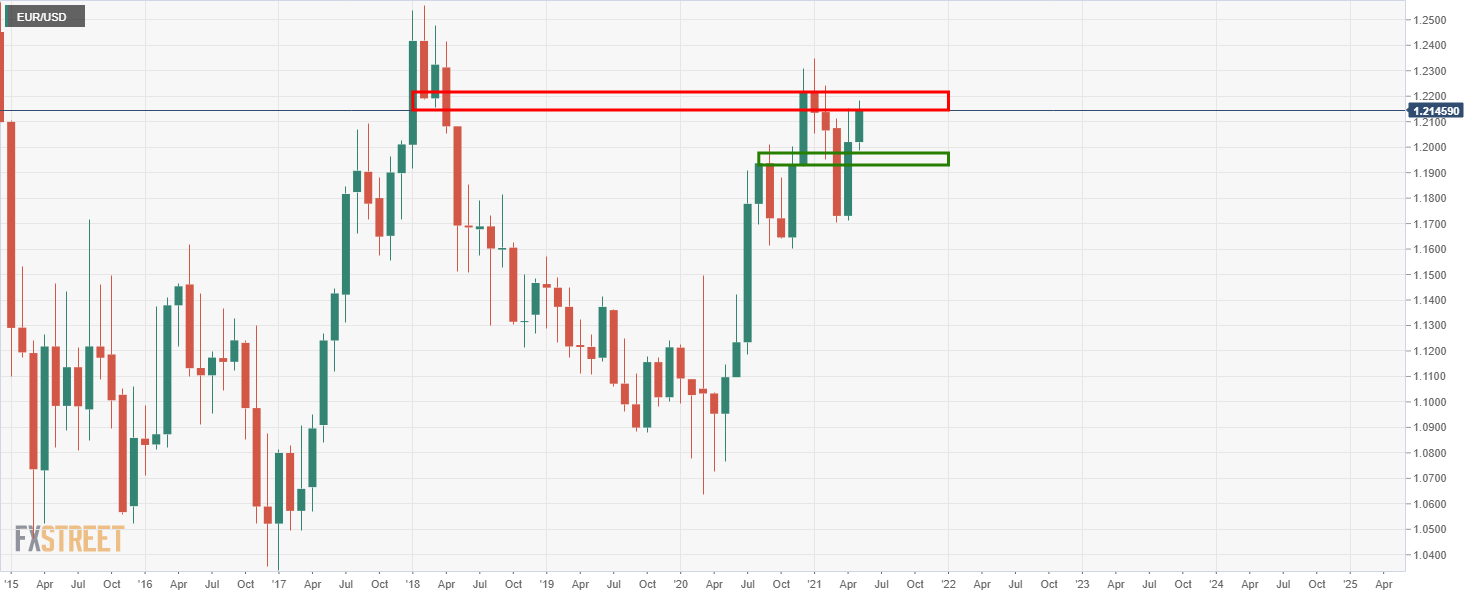
The bulls need to clear the monthly resistance at this juncture or face an onslaught from the bears to test the support structure. 

Weekly chart

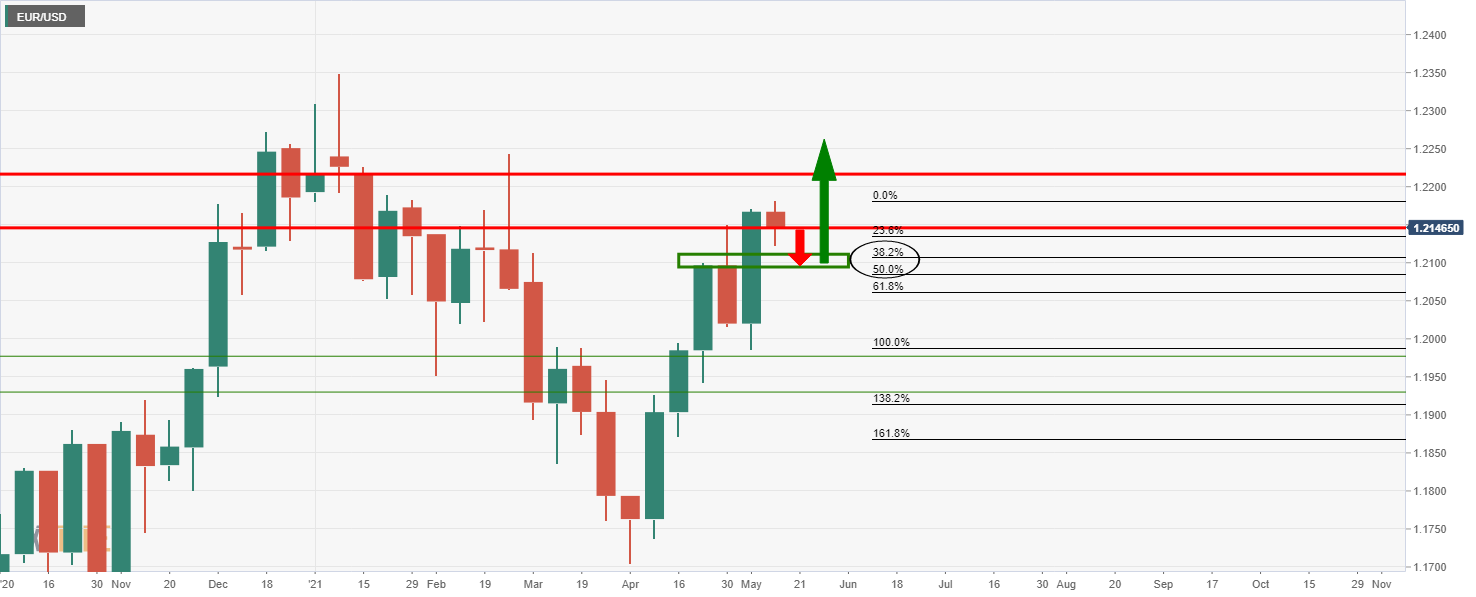
The weekly chart is showing signs of upside exhaustion and would be expected to see the price to the 38.2% or the 50% mean-reversion targets. 

Daily chart

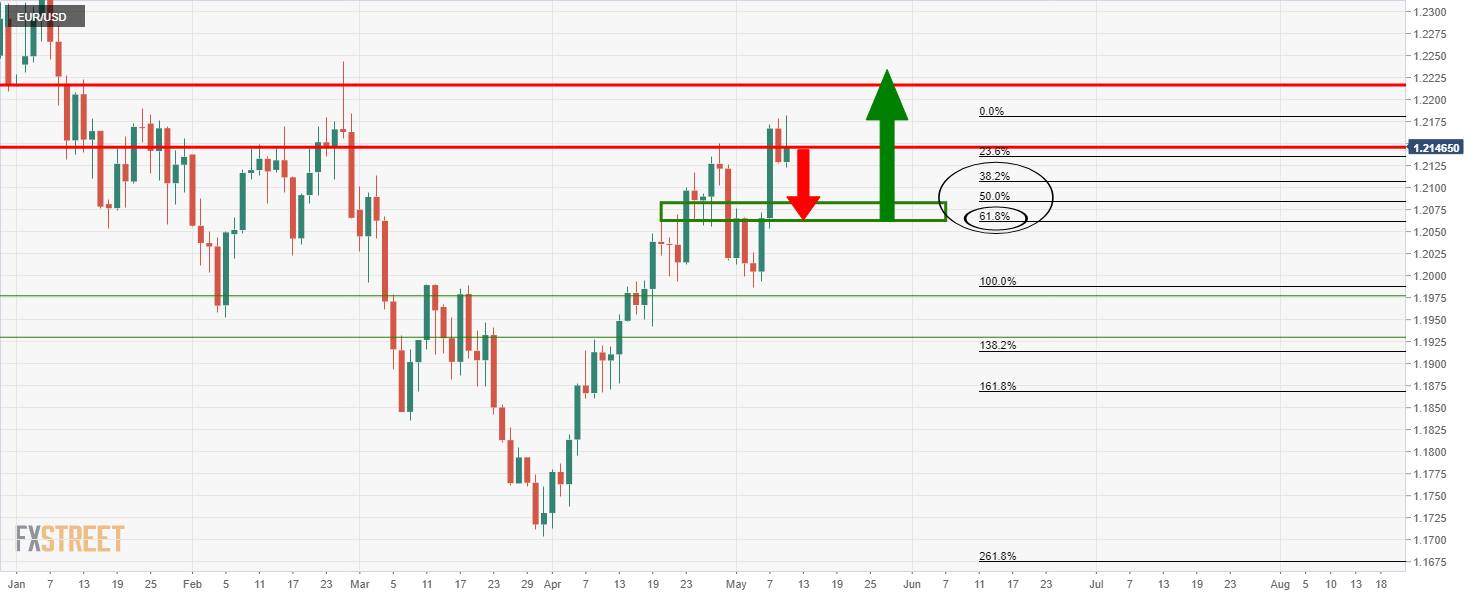
The daily chart is showing a W-formation on the candles.

The rule of thumb is that the majority of such formations will see a restest of the prior highs of the pattern which will act as support prior to a bullish continuation. 

In this case, the 61.8% Fibonacci is the key target. 


Forex Today: US inflation takes center stage

What you need to know on Wednesday, May 12: Tensions mounted as the focus is on US inflation data to be out on Wednesday. Higher commodities prices se
مزید پڑھیں Previous

United States API Weekly Crude Oil Stock increased to -2.533M in May 7 from previous -7.688M

United States API Weekly Crude Oil Stock increased to -2.533M in May 7 from previous -7.688M
مزید پڑھیں Next