ہمارے بہترین اسپریڈز اور شرائط
 پلیٹ فارم کے بارے میں

GBP/USD is sitting pretty above key technical support across the daily, 4-hour and 1-hour charts. The market structure, however, has something to offer both the bears and the bulls and the following analysis illustrates the bias one way or the other.
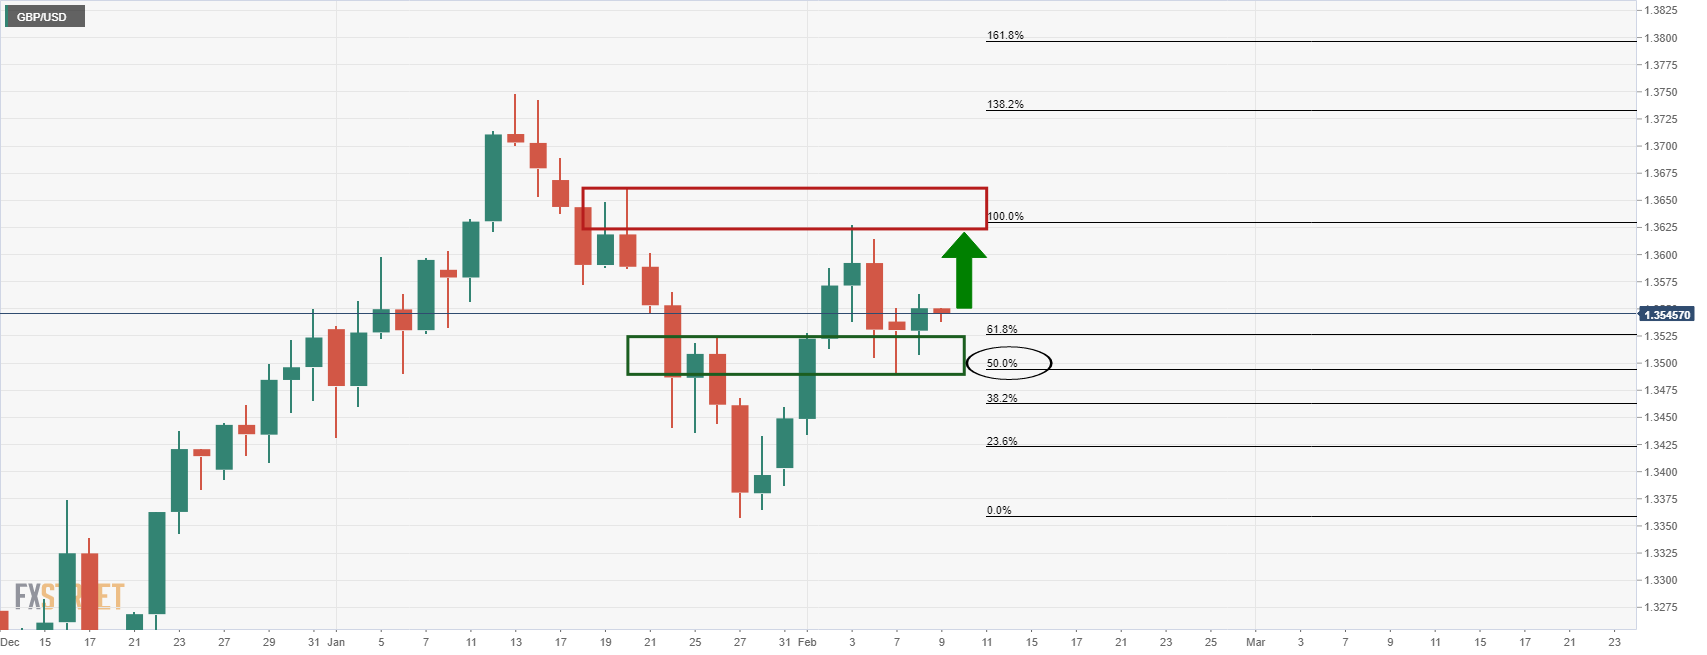
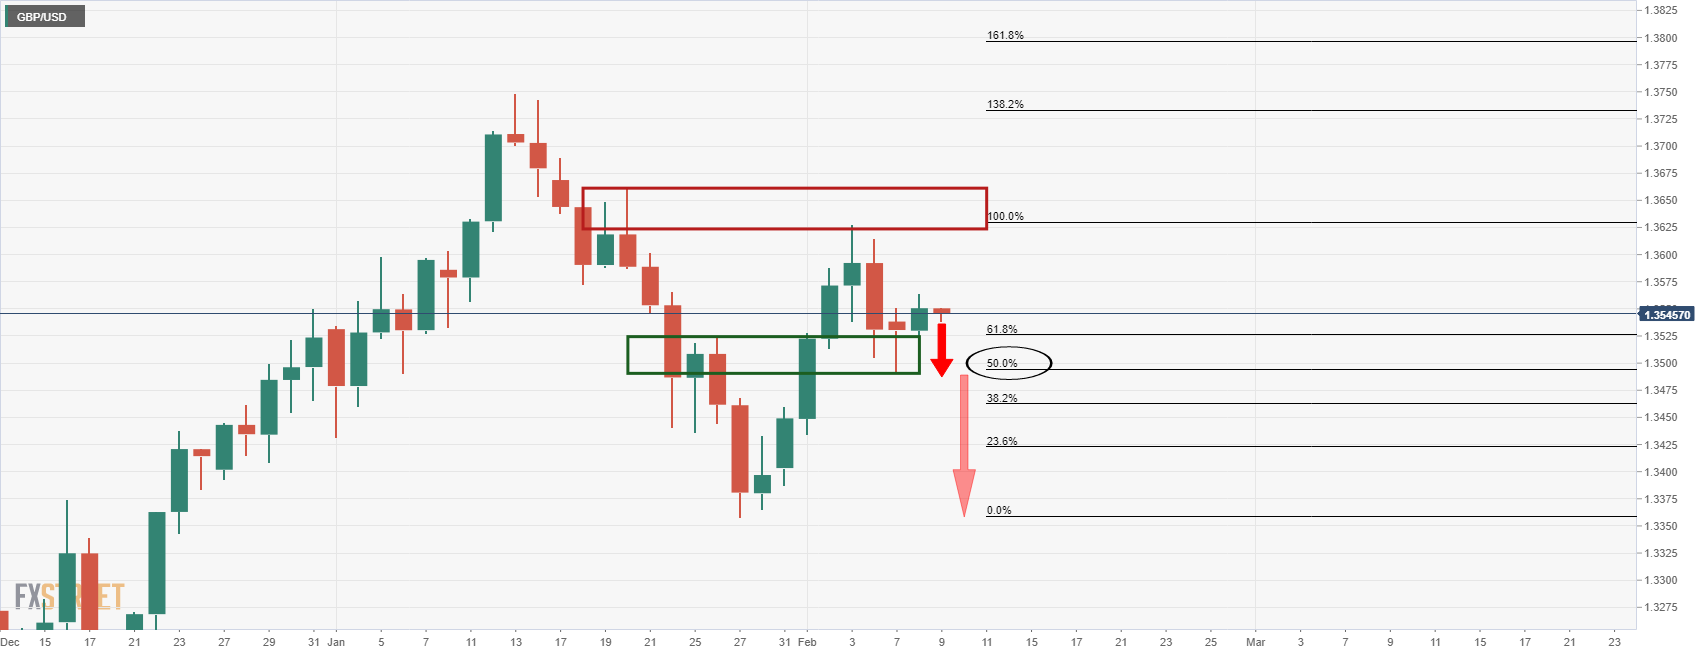
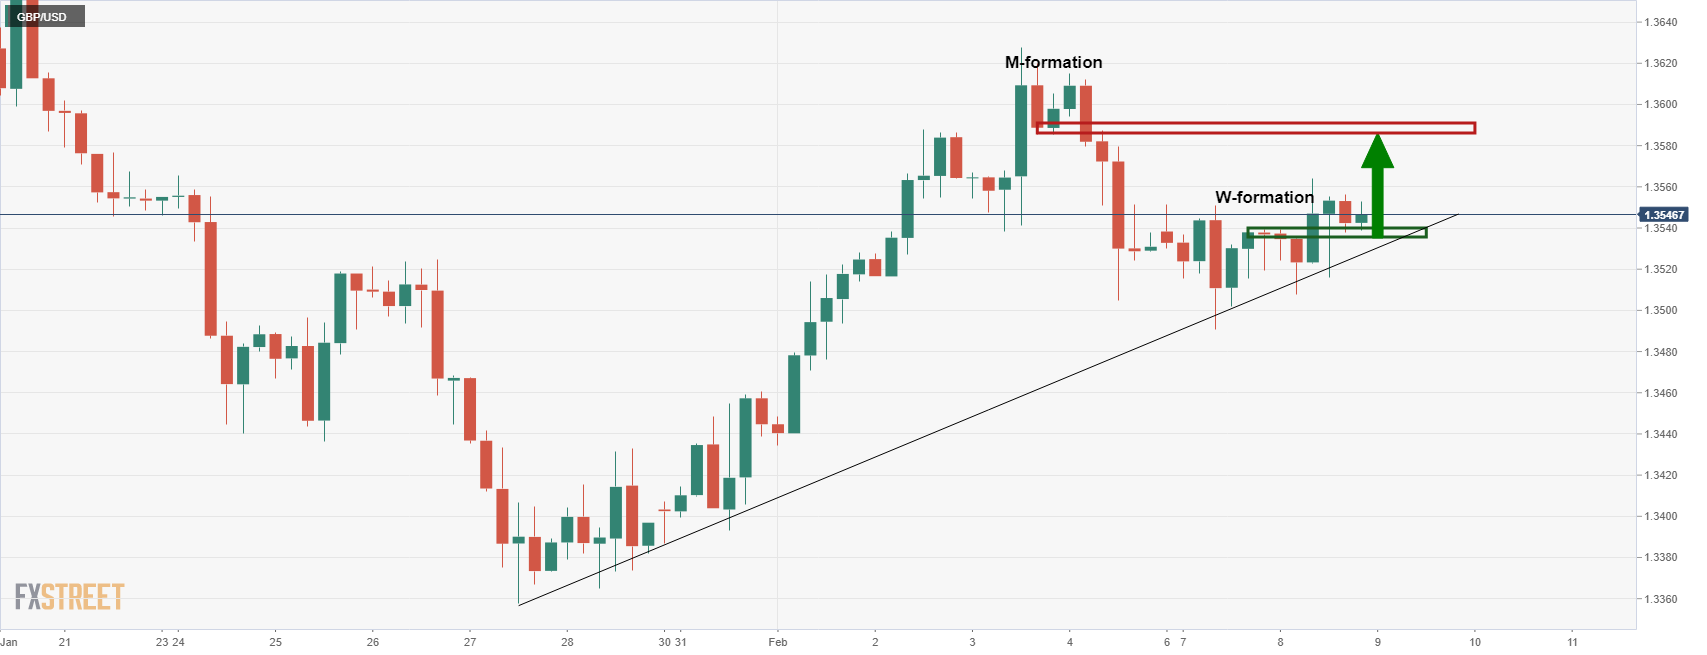
The daily chart shows that the price support at the neckline of the W-formation and after retracement back to the 50% mean reversion level, the bulls have moved back in there is a focus on an extension higher.
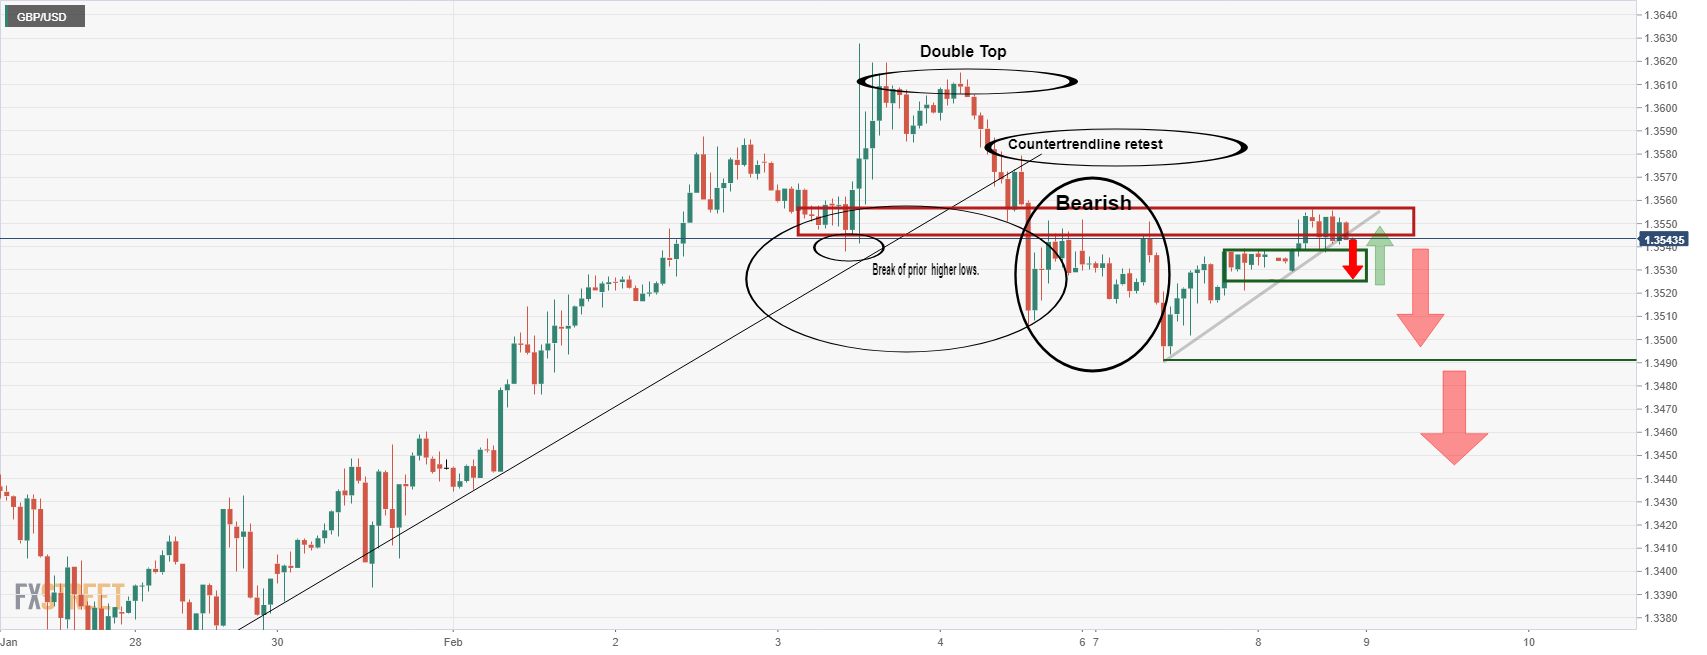
However, from the 1-hour chart, we can see that the price is actually breaking down following the break of the prior higher lows at around 1.3540. The price has since moved back into liquidity near 1.3550's. This could be the ticket for a considerable pivot to the downside and the 1.3520's then the 1.3490's will be eyed.