
ہمارے بہترین اسپریڈز اور شرائط
 پلیٹ فارم کے بارے میں

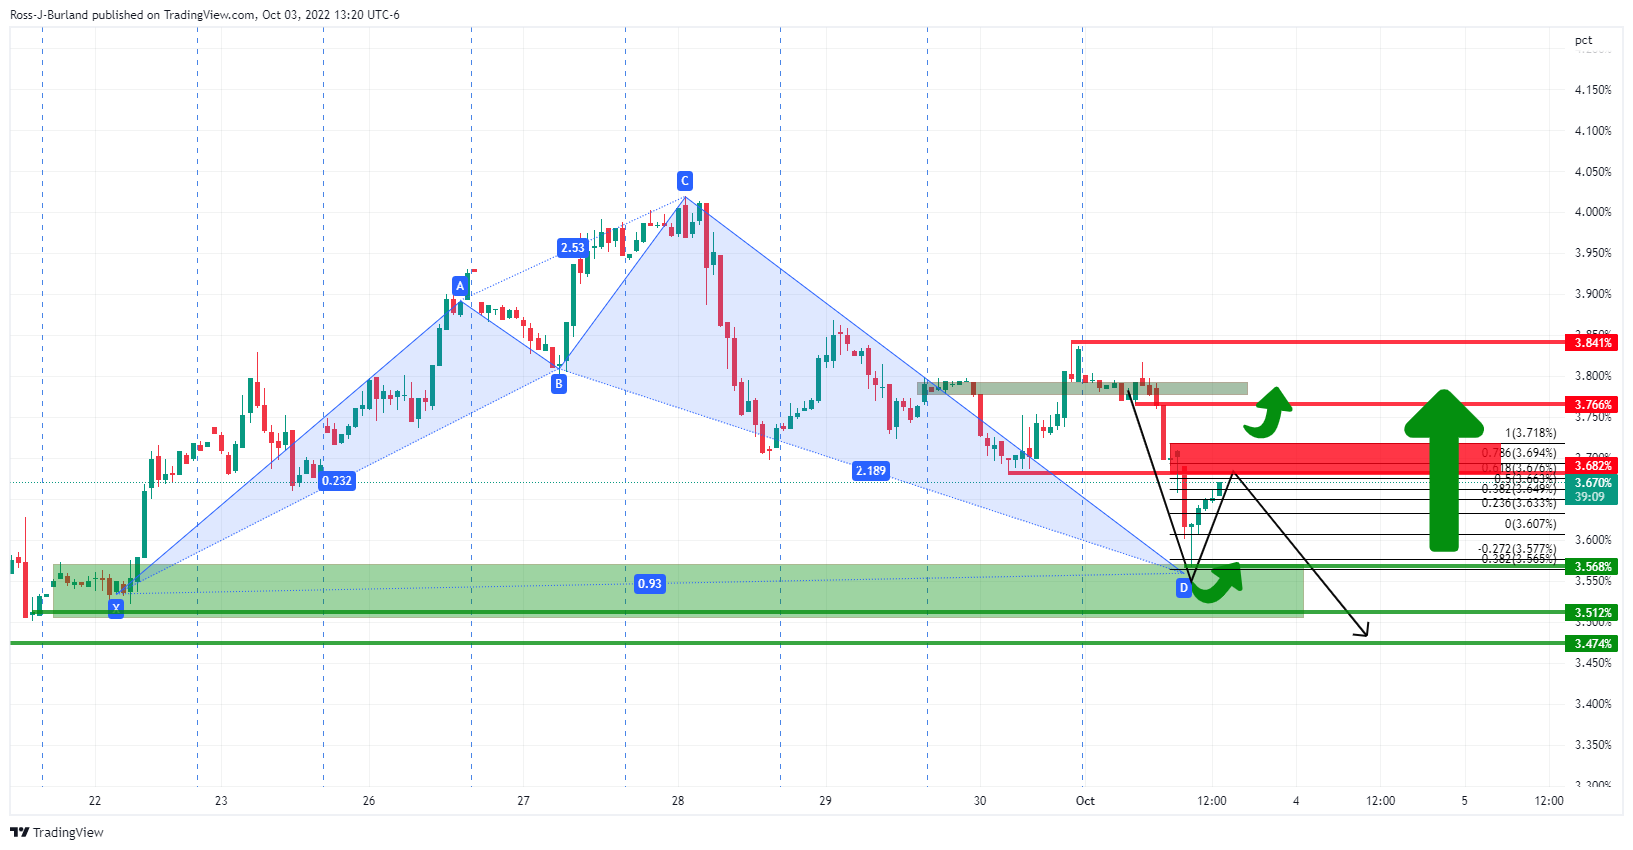
GBP/USD is rallying and defying gravity as the US dollar runs into bears with the US yields softening at the start of the week. The following illustrates the current trajectory across the three mentioned assets and the potential for a downside correction in the coming sessions or days in cable.
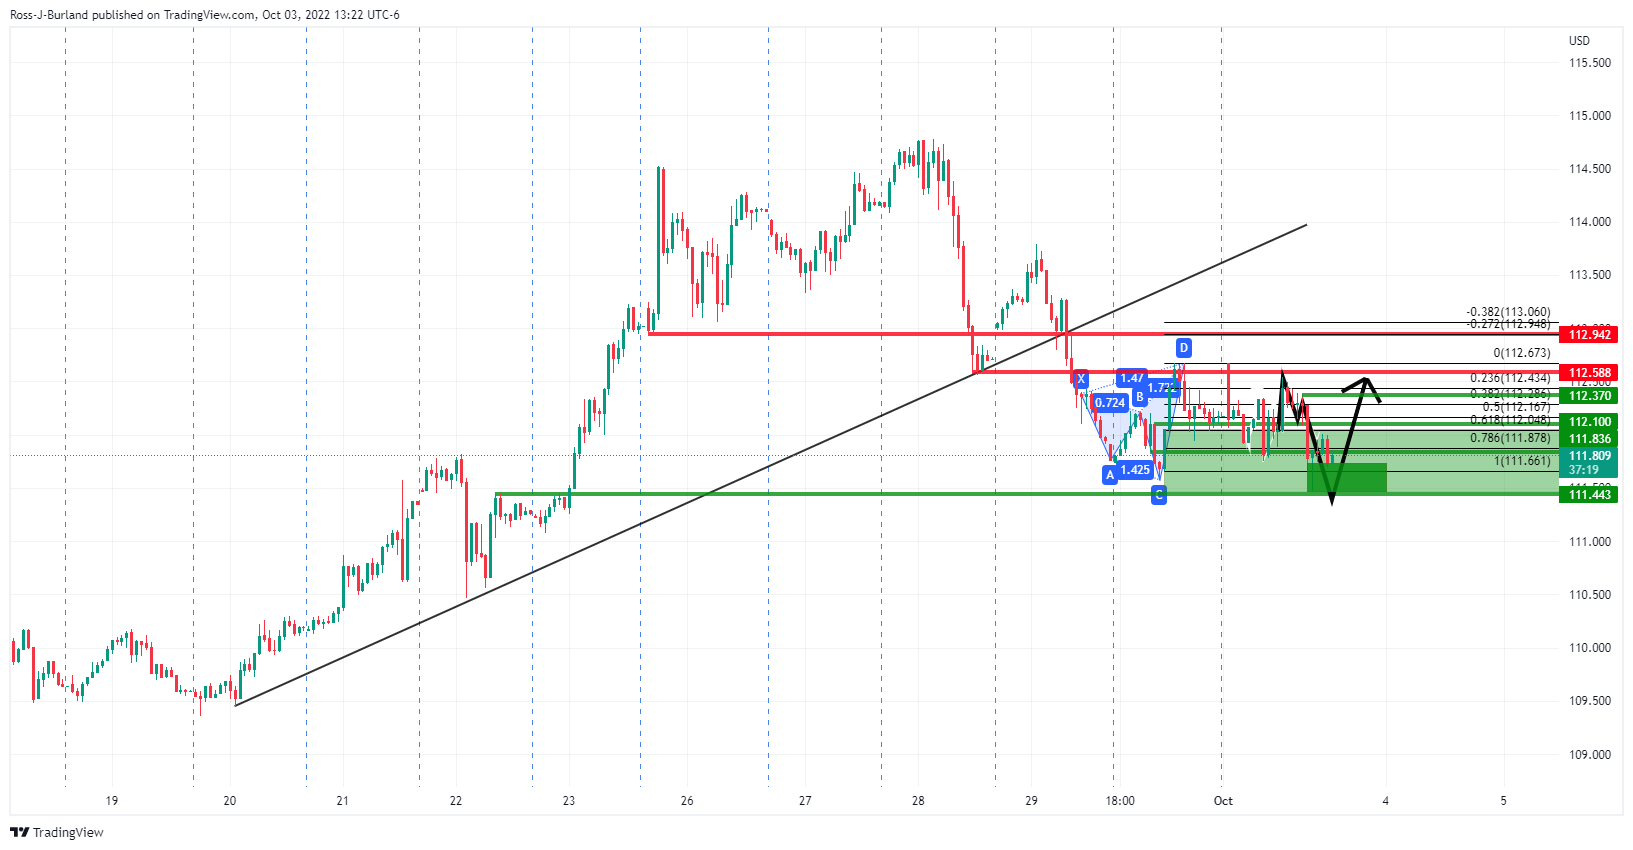
The 10-year US treasury yield has slumped into a key area of support leaving a bullish harmonic shark pattern on the hourly time frame. The price has subsequently moved up to test an old support area that could act as resistance for the sessions ahead. However, if this area were to break, then that would be supportive of an otherwise softer US dollar and be expected to weigh on cable.
DXY H1:
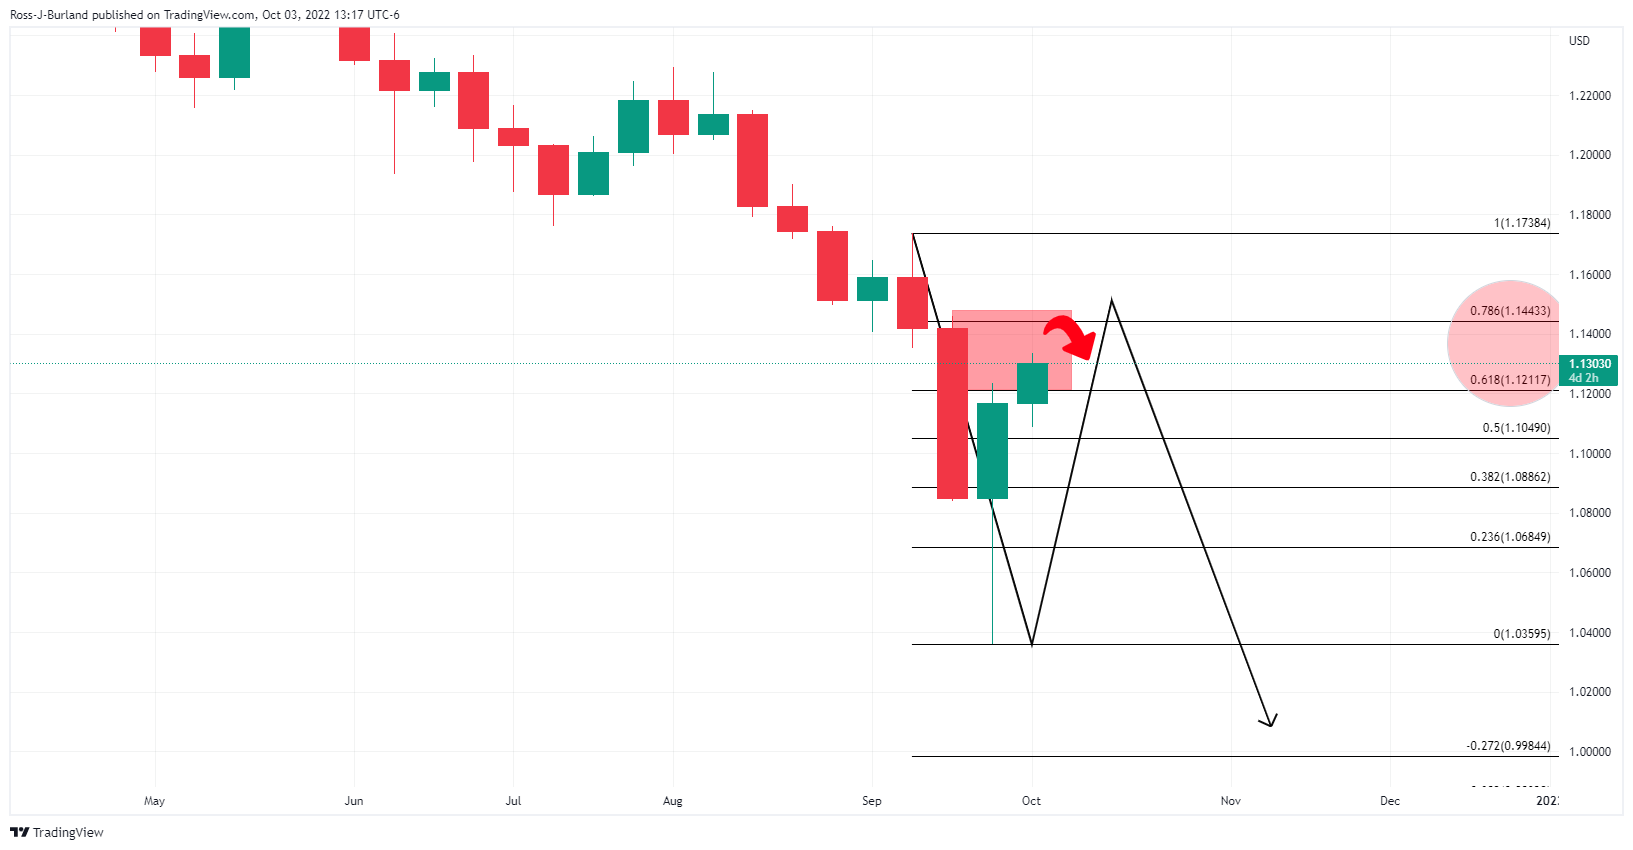
The weekly and daily charts, above and below respectively, have seen a significant correction along the Fibonacci scales.
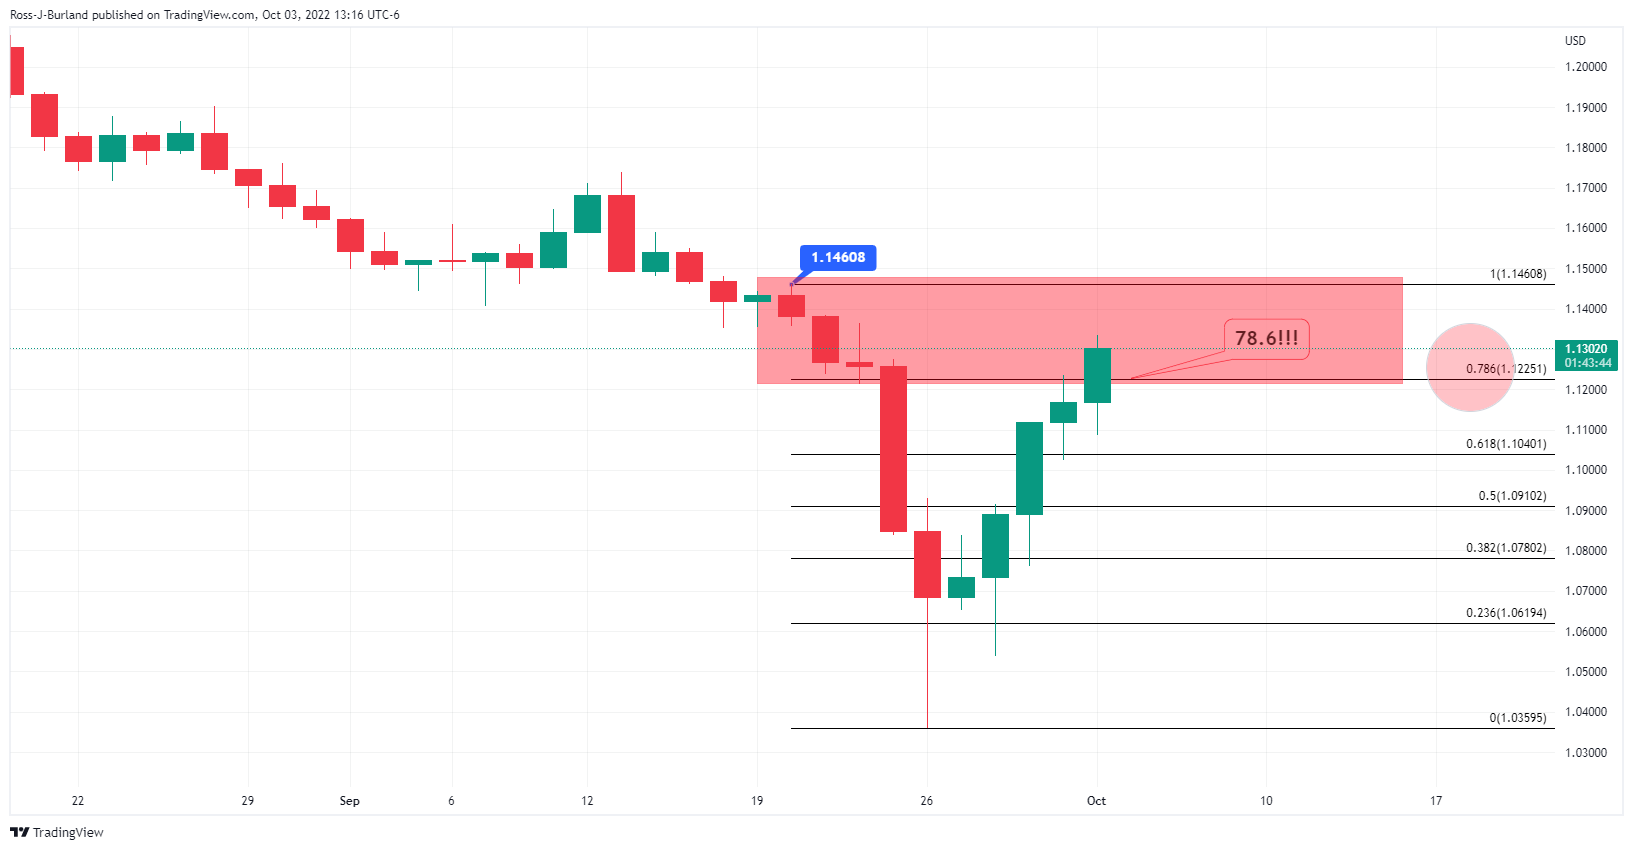
The price is attempting to come around in a full circle on the daily chart with the break of the 78.6% ratio. However, the structure on the hourly chart can be monitored in the case of a downside correction as follows:
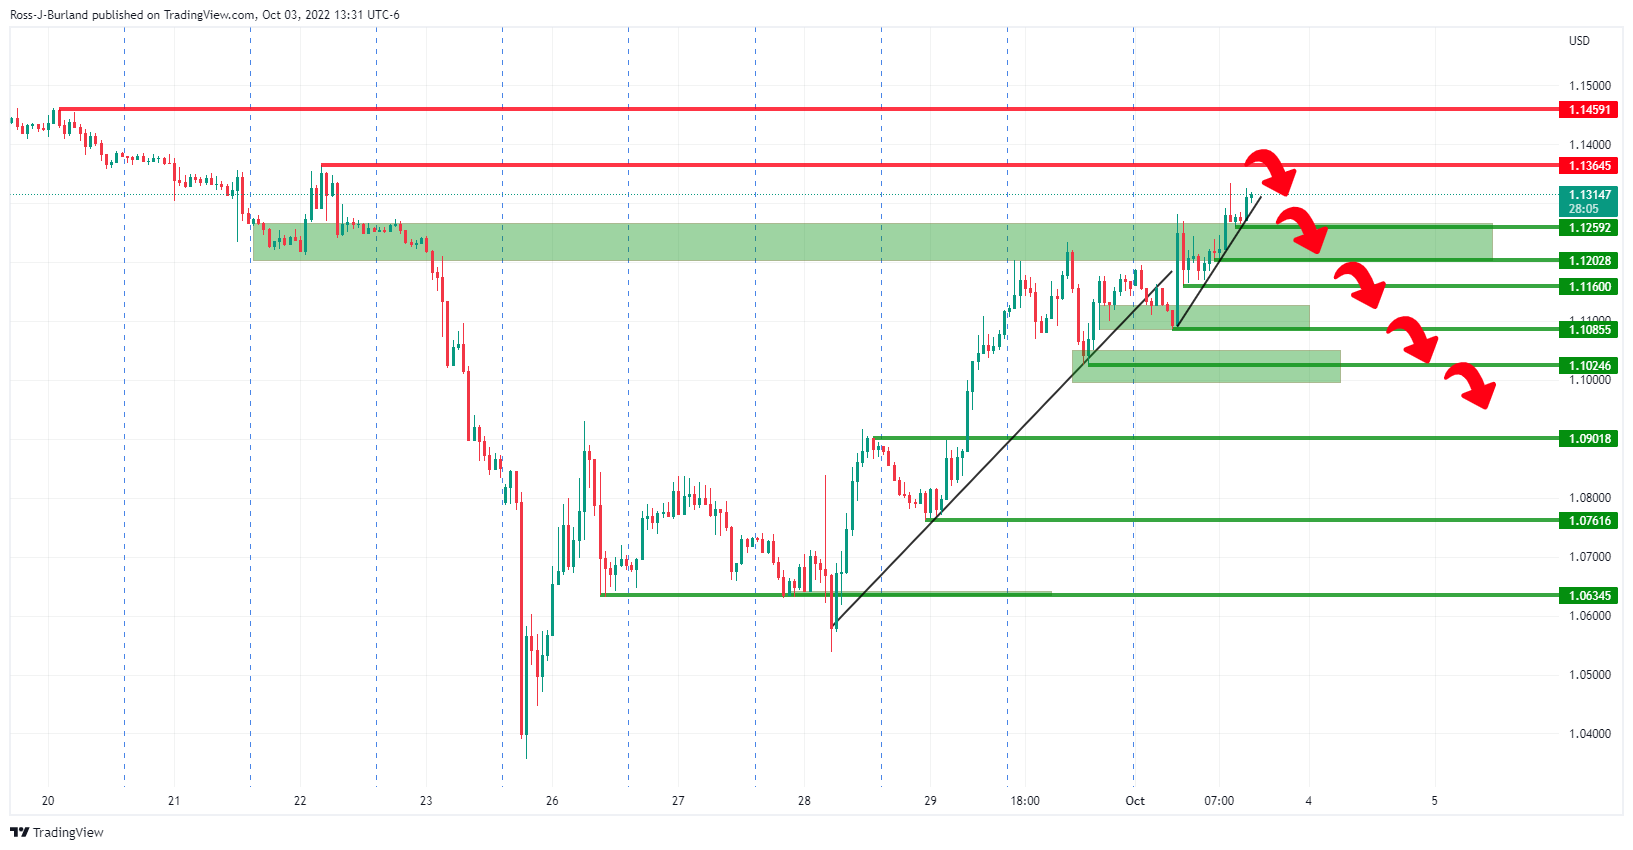
1.1200/60 guards risk of a significant cascade of offers below targeting 1.1100 and 1.1020.


